SUSTAINABLE DEVELOPMENT AND CLIMATE CHANGE
Introduction
• The year 2019 marked the fourth anniversary of adoption of 2030 Agenda for Sustainable Development and the Paris Agreement and India is moving forward on the path of Sustainable Development Goals (SDGs) implementation.
• This chapter analyses India’s performance in moving towards economic growth, keeping in mind the imperatives of sustainable development. It also highlights scope for improvement as well as constraints in achieving targets.
India and SDG
• India’s score in the composite SDG India Index 2019 has improved from 57 in 2018 to 60 in 2019 largely driven by commendable country wide performance in five SDG goals – 6 (Clean Water and Sanitation), 7 (Affordable and Clean Energy), 9 (Industry, Innovation and Infrastructure), 15 (Life on Land) and 16 (Peace, Justice and Social Institutions) – where India has scored between 65 and 99.
• The goals that demand special attention are – 2 (Zero Hunger) and 5 (Gender Equality) – where the overall country score is below 50.
• As per the Index, Kerala, Himachal Pradesh, Tamil Nadu, Andhra Pradesh, Telangana, Karnataka, Goa, Sikkim, Chandigarh and Puducherry are the front runners while none of the States/ UTs fall in the Aspirant category.
SDG India Index 2019
• It is more comprehensive than SDG India Index 2018 and highlights the progress being made by the States/UTs on a wider set of 100 indicators spread across 16 goals.
• The SDG score varies from 0 to 100. A score of 100 implies that the States/UTs have achieved the targets set for 2030; a score of 0 implies that the particular State/UT is at the bottom of the table.
• States with scores equal to/greater than 65 are considered as Front-Runners; in the range of 50-64 as Performers and as Aspirants if the score is less than 50.
SDG Nexus: A New Paradigm Approach
• The ‘nexus’ approach employs the principles of integrating management and governance across sectors
• Under this approach, the SDG goals are used as a medium which allows for inter-linkages of different sectors and thematic areas. Since, a few SDGs have overlapping objectives with one another, the policies developed and aligned to achieve the goals must consider and identify these linkages and in turn identify the potential trade-offs that might limit the physical achievement of the target under a goal.
• For example: Under education and electricity Nexus, it was observed that with electricity, the schools’ access to modern methods and techniques of teaching helps holistic development of students and increase their attraction towards learning thus increasing the net enrolment ratio. It is observed that States with lower literacy rates have low electricity rates at the schools and vice-versa.
• Under health and electricity nexus, a positive relationship is witnessed between the electricity consumption and fall in the Infant Mortality Rate (IMR) in the country as many of the health improvement schemes- providing paediatric care, new- born emergency services, and successful vaccination rely heavily on the availability of electricity at the health centres.
Climate Change
In its NDC, India promised
• to reduce its emission intensity of GDP by 33 to 35 per cent below 2005 levels by the year 2030
• that 40 per cent of cumulative electric power installed capacity would be from non-fossil fuel sources by 2030
• to increase its forest cover and additional carbon sink equivalent to 2.5 to 3 billion tons of carbon dioxide by 2030.
• Through various initiatives and schemes that are aligned with its Nationally Determined Contributions (NDC) under the Paris Agreement, India has strived to ensure that it follows a growth path that delivers sustainable development and protects the environment. These are:
o Swachh Bharat Mission (Urban): In a span of five years, all urban areas of 35 States/ UTs have become ODF and the percentage of waste processing rose from around 18 per cent in 2014 to 60 per cent.
o Renewable energy targets: India had announced 175 Gigawatt (GW) targets for renewables by 2022 and has already achieved 83 GW. India also aims to increase the target till 450 GW.
o Emission intensity: As per the Second Biennial Update Report (BUR) submitted as a Party to the UNFCCC, the emission intensity of India’s GDP has reduced by 21 per cent over the period of 2005-2014.
o Energy Conservation Building Code (ECBC): Under it, the minimum energy performance standards under resulted in energy saving of 84.34 million kWh, reduction in GHG emission of 69,154 tons of CO2 per year.
o UJALA scheme for LED bulb distribution: has crossed 360 million whereas under street light national program, 10 million conventional streetlights have been replaced by LED street lights thus cumulatively saving 43 million tons of CO2 emission.
o National Electric Mobility Mission Plan (NEMMP) 2020: Under its Faster Adoption and Manufacturing of (Hybrid &) Electric Vehicles in India (FAME India) scheme to promote manufacturing and sustainable growth of electric and hybrid vehicle technology a total of 280,994 vehicles have been sold till 2019.
o The National Bio-fuels Policy 2018: targets 20 per cent blending of ethanol in petrol and 5 per cent blending of biodiesel in diesel by 2030.
o National Adaptation Fund on Climate Change (2015): supports concrete adaptation activities for the States/UTs that are particularly vulnerable to the adverse effects of climate change and are not covered under on-going schemes.
o National Action Plan on Climate Change (NAPCC) 2008): India has decided to revise the NAPCC in line with the NDCs to make it more comprehensive in terms of priority areas. The progress under its eight missions is given below:
• National Mission for Enhanced Energy Efficiency (NMEEE): Under it, The Perform, Achieve and Trade (PAT) scheme was designed on the concept of reduction in Specific Energy Consumption. In PAT cycle –V (April 2019), the total energy consumption of the 110 Designated Customers (DCs) comes out to be 15.244 Million Tons of Oil Equivalent (Mtoe) and it is expected to get a total energy savings of 0.5130 Mtoe.
• National Solar Mission aims to increase the share of solar energy in the total energy mix. Under the total target of 100 GW, 32.5 GW of solar electric generation capacity has been installed.
• National Water Mission focuses on monitoring of ground water, aquifer mapping, capacity building, water quality monitoring and other baseline studies. While granting ‘No Objection Certificate’ for drawing ground water, Central Ground Water Authority (CGWA) insists for mandatory rain water harvesting as per the guidelines issued.
• National Mission for a Green India emphasises the landscape approach to treat large contiguous areas of both forest and non-forest, public and private lands with a key role of the local communities in planning, implementation and monitoring. A sum of Rs 343.08 crore has so far been released under the mission for undertaking afforestation activities over an area of 126916.32 ha in 13 states.
• National Mission on Sustainable Habitat is being implemented through three programmes: Atal Mission on Rejuvenation and Urban Transformation, Swachh Bharat Mission, and Smart Cities Mission. Energy Conservation Building Rules 2018 for commercial buildings has been made mandatory. Under Mass Rapid Transit System, 585 km of metro rail is in operation; 620 km is under construction. Under the Bus Rapid Transit System (BRT), 223 kms of BRT corridors operational in 8 cities and 505 kilometers of BRT corridors are under construction in 14 cities.
• National Mission for Sustainable Agriculture aims at enhancing food security and protection of resources. Key targets include covering 3.5 lakh hectare of area under organic farming, 3.70 under precision irrigation, 4.0 lakh hectare under System of Rice Intensification, 3.41 lakh hectare under diversification to less water consuming crop, 3.09 lakh hectare additional area under plantation in arable land and 7 bypass protein feed making. The mission has resulted in the formation of National Innovations on Climate Resilient Agriculture, a network project.
• National Mission for Sustaining the Himalayan Ecosystem aims to evolve suitable management and policy measures for sustaining and safeguarding the Himalayan Ecosystem. The key achievements include setting up of: – Centre of Glaciology at Wadia Institute of Himalayan Geology, thematic task forces in 6 lead institutions, State Climate Change Centers in 11 out of 12 Himalayan States, 40 Training Programmes under State Climate Change Centres organized with 5500 people trained, formation of Inter-University Consortium of 4 universities on Himalayan Cryosphere and Climate Change.
• National Mission on Strategic Knowledge for Climate Change seeks to build a knowledge system that would inform and support national action for ecologically sustainable development. Key achievements include setting up of 11 Centres of Excellence and 10 State Climate Change Centres. 116 Training programmes have been launched and 14000 people have been trained; a total of 23 major R&D programmes have been spread over the country.
Green Climate Fund
• In 2009, developed countries committed to a goal of mobilizing jointly US$ 100 billion a year by 2020 to address the needs of developing countries and decided that a significant portion of such funding should flow through the GCF. In contrast, the total to the GCF are a meagre US$ 10.3 billion. GCF’s first replenishment (2020- 2023) process so far witnessed 28 countries pledging resources to replenish the Fund for an amount of US$ 9.7 billion, which is even quantitatively lower than the Initial Resource Mobilization period.
• In the 25th session of the Conference of the Parties (COP 25) to the UNFCCC held at Madrid, Spain, India reiterated its commitment to implement the Paris Agreement in its letter and spirit and to act collectively to address climate change including consideration of principles of equity and common but differentiated responsibilities and respective capabilities.
India’s initiatives at the International stage
• International Solar Alliance (ISA): aims to pave the way for future solar generation, storage and technologies for Member countries’ needs by mobilizing over US$ 1000 billion by 2030.
o In 2019, ISA has taken up the role of
✓ ‘enabler’ by institutionalizing 30 Fellowships from the Member countries with a premier institution (IIT Delhi) in the host country, and training 200 Master Trainers from ISA Member countries;
✓ ‘facilitator’ by getting the lines of credit worth US$ 2 Billion from EXIM Bank of India and US$ 1.5 Billion from France
✓ ‘incubator’ by nurturing initiatives like the Solar Risk Mitigation Initiative and
✓ ‘accelerator’ by developing tools to aggregate demand for more than 1000 MW solar rooftop, 10,000 MW of Solar Mini-Grid and 270,000 solar water pumping systems.
• Coalition for Disaster Resilient Infrastructure: launched on the side lines of UN Secretary General’s Climate Action Summit in 2019 promotes the resilience of new and existing infrastructure systems to climate and disaster risks, thereby ensuring sustainable development.
India and its forests
• According to FAO, India accounts for 2 percent of total global forest area in 2015. India is among a few countries in the world where, despite ongoing developmental efforts, forest and tree cover are increasing considerably.
• The forest and tree cover have reached 80.73 million hectare which is 24.56 per cent of the geographical area of the country.
o There has been an increase of 3,976 sq. km (0.56 per cent) of forest cover, 1,212 sq. km (1.29 per cent) of tree cover and 5,188 sq. km (0.65 per cent) of forest and tree cover put together, at the national level as compared to the previous assessment 2017.
• In the Forest Report, 2019, there is an increase of 42.6 million tons in the carbon stock of the country as compared to the last assessment 2017.
o Net change in carbon stock is highest in soil organic carbon followed by Above Ground Biomass (AGB) and Dead wood. Litter carbon registered negative growth rate as compared to 2017 assessment.
• India is one of the 17 mega diverse countries in the world as per the Shannon-Weiner Index used in India State of the Forest Report 2019. The index is used for measuring species richness and abundance among various habitats.
• The Index shows that
o Tropical Evergreen forest is high in Karnataka followed by Kerala.
o Semi-evergreen forest are high in Karnataka.
o Tropical moist deciduous forests cover is high in Arunachal Pradesh, Karnataka and Maharashtra.
o Tropical dry deciduous forest is high in Arunachal Pradesh
o Tropical Littoral and swamp forests are high in UP and
o Tropical thorn forests are high in Andhra Pradesh.
Agriculture Residue Burning – A major concern
• Being the second largest agro-based economy India, generates a large amount of agricultural waste, including crop residues and about 178 million tonnes of surplus crop residues are available in the country.
• Varieties of surplus crop residues are burnt especially in northern States of Punjab, Haryana, UP, and Rajasthan depending on the agro-climatic region; however, about 50 per cent of all crop residue burnt in the country are residues of rice crop.
• Because huge volumes of residues are burnt in a very short duration (of few weeks), it leads to significant contributions in pollutant levels like PM2.5 and PM10 and deterioration of air quality.
• Initiatives taken by the government include:
o National Policy for Management of Crop Residue, under which NGT, directed and prohibited agricultural residue burning in any part of Delhi, Rajasthan, Punjab, Uttar Pradesh and Haryana. Burning crop residue is a crime under Section 188 of the IPC and under the Air and Pollution Control Act of 1981.
o Promotion of Agricultural Mechanization for In-Situ Management of Crop Residue: Under scheme, the agricultural machines and equipment for in-situ crop residue management such as Super Straw Management System for Combine Harvesters, Happy Seeders, Hydraulically Reversible MB Plough, Paddy Straw Chopper, Mulcher, Rotary Slasher, Zero Till Seed Drill and Rotavators are provided with 50 per cent subsidy to the individual farmers and 80 per cent subsidy for establishment of Custom Hiring Centres.
• With various efforts, the total number of burning events have reduced significantly over the years. However, continuation of this practice by farmers is reported every year starting winter and the serious concerns about its impact on air quality are raised.
• Various studies suggest ways to address this issue, which include:
o Promote the practice of conservation of agriculture with low lignocellulosic crop residues like rice, wheat, maize etc. With this, seeds of the next crop can be sown without any problem associated with residues of the previous crops and also without affecting the crop productivity.
o Create markets for crop residue-based briquettes and mandate nearby thermal power plants to undertake co-firing of crop residues with coal.
o Create special credit line for financing farm equipment and working capital for private sector participation
o Promote use of crop residue-based biochar briquettes in local industries, brick kiln and hotel/dhaba as an alternate fuel.
Construction and Demolition (C&D) Waste
• Annual consumption of construction materials (sand, soil & stone) in India is estimated to be 3,100 million tonnes. Unscientific disposal of C&D waste is one of the key contributors to the air and water pollution.
• Circular Economy approach in Delhi for C&D waste management : In 2009, the Municipal Corporation of Delhi and IL&FS Environmental Infrastructure and Services Ltd. (IEISL) pioneered setting up a project to recycle 500 Tonnes Per Day (TPD) of C&D waste at Burari, Delhi (first of its kind facility in the country) to address the waste generated during Commonwealth Games preparations.
Since then, the Burari facility along with two other C&D recycling facilities (under East Delhi Municipal Corporation and Delhi Metro Rail Corporation respectively) in Delhi are together recycling over 2,650 TPD C&D waste. All three Delhi plants have together processed over 5 million tonnes C&D waste.
The pioneering facility of Burari also helped in paving the way forward in formulating the C&D Waste Management Rules, 2016.
• Application of recycled C&D products includes usage in other civil works and also in road construction.
Way forward
• SDGs can be achieved through high standards of governance, monitoring and implementation at all levels. In the spirit of cooperative federalism, the States and Central Government are walking together to bring a change that India needs.
• Despite the continuous and definitive efforts of stakeholders, scarce financial resources continue to be the biggest constraint.
• Developed countries should honour their financial obligations and promises under the multilateral environmental agreements. Hence, adequate provision of finance, technology transfer, and capacity building to developing countries to facilitate the effective implementation of the SDGs and Paris Agreement on climate change are critical.
• India has and will continue to do its fair share of responsibilities while strongly calling for developed countries to take the lead.
AGRICULTURE AND FOOD MANAGEMENT
Introduction
This sector plays a significant role in rural livelihood, employment and national food security. Almost 70 percent of India’s rural households still depend primarily on agriculture for their livelihood. In the light of this, Government is rightly aiming at doubling farmer’s income by 2022.
Overview of Agricultural Sector
• Share in Goss Value Added (GVA): Share of agriculture and allied sectors in GVA has declined from 18.2 percent in 2014-15 to 16.5 percent in 2019-20.
• Growth has fluctuating trend: Agriculture, Forestry and Fishing sector is estimated to grow by 2.8 percent in 2019-20 as compared to growth of 2.9 percent in 2018-19.
• Gross Capital Formation (GCF) also has fluctuating trend: GCF (as a percentage of GVA) has been showing a fluctuating trend from 16.5 percent in 2012-13 to 15.2 percent in 2017-18.
Improving farm productivity and ensuring economic security
• Minimum Support Price (MSP)
To encourage higher investment and production, government announces MSPs for twenty-two mandated crops; and Fair and Remunerative Price for Sugarcane.
o Government had increased MSPs for all mandated kharif, rabi and other commercial crops with a return of 1.5 times over cost of production.
o Direct Support: In addition to this, several direct income/investment support schemes have been announced.
• Mechanization in Agriculture: With the shrinking land and water resources and labour force, the onus of increasing productivity rests on mechanization of production and post harvesting operations.
o Farm power availability: Government has decided to enhance farm power availability from 2.02 kW per ha (2016-17) to 4.0 kW per ha by the end of 2030.
o Growing farm mechanization market: Farm mechanization market in India has been growing at a CAGR of 7.53 per cent during 2016-2018. This is in conjunction with India being the largest tractor industry in the world.
o Sub-mission on Agricultural Mechanization: Under the scheme, assistance is provided to State governments to impart training and demonstration of agricultural machinery, provide assistance to farmers for procurement of various agricultural machineries and equipment and for setting up of Custom Hiring Centre.
o In-situ crop residue management: Special scheme was created for in-situ management of residue in the states of Punjab, Haryana, UP and NCT of Delhi. Special scheme was created for in-situ management of residue in the states of Punjab, Haryana, UP and NCT of Delhi machines and equipment for in-situ crop residue management are provided with 50 per cent subsidy to the individual farmers and 80 per cent subsidy for establishment of Custom Hiring Centres.
o Low Overall Mechanization: Farm mechanization in India has been 40-45 per cent compared to other countries such as USA (95 per cent), Brazil (75 per cent) and China (57 per cent). Major reasons being economies of operation due to small holdings, access to power, credit cost and procedures, uninsured markets and low awareness.
o Regional Disparities: Northern India has higher levels of mechanization compared to other regions. (Rice and Wheat crops having the largest extent of mechanization)
• Micro-Irrigation: Micro-irrigation includes drip irrigation and sprinkler irrigation which has gained immense popularity amongst the farmers.
o PMKSY: Pradhan Mantri Krishi Sinchayee Yojana (PMKSY) was launched to enable mirco-irrigation through its Per Drop More Crop (PDMC) component.
o Farmers have had following benefits from this technology-
✓ Saving of irrigation water from 20 to 48 per cent.
✓ Energy saving from 10 to 17 per cent.
✓ Saving of labour cost from 30 to 40 per cent.
✓ Saving of fertilizers from 11 to 19 per cent.
✓ Increase in crop production from 20 to 38 per cent.
o Micro-Irrigation Fund (MIF): A dedicated Micro Irrigation Fund (MIF) created with NABARD for facilitating the States in mobilizing the resources for expanding coverage of Micro Irrigation.
• Agricultural Credit: The agricultural credit flow target for 2019-20 has been fixed at Rs 13.5 lakh crore.
o Skewed Regional Distribution: It is observed that credit is low in North Eastern, Hilly and Eastern States, whereas it is highest in the Southern states. (Kerala, Andhra Pradesh and TN)
• Crop Insurance: Pradhan Mantri Fasal Bima Yojana (PMFBY) provides comprehensive coverage of risks from pre-sowing to post harvest against natural non-preventable risks.
o Increasing Coverage: PMFBY envisages increase in coverage from the existing 23 per cent to 50 per cent of Gross Cropped Area (GCA) in the country.
o National Crop Insurance Portal (NCIP): NCIP is a web-based integrated IT platform that provides interface among all stakeholders to access/enter data relating to insured farmers under PMFBY and Restructured Weather Based Crop Insurance Scheme (RWBCIS).
✓ The aim of this Portal is to avoid delay in credit of claim amount to farmers account and for proper monitoring of PMFBY.
o Revision of Operational Guidelines: On the basis of the experience of implementation of PMFBY, government has comprehensively revised the operational guidelines of the scheme.
✓ The scheme now includes interest penalties on delays, detailed standard operating procedures and inclusion of perennial crops and damage by wild animals on pilot basis.
Income/Investment Support Schemes
Pradhan Mantri Kisan Samman Nidhi (PM-KISAN)
• Under the Scheme an income support of Rs. 6000 per year is provided to all farmer families across the country.
Similar Schemes have been created by several state governments.
For example-
• Krushak Assistance for Livelihood and Income Augmentation (KALIA) Scheme of Odisha.
• Mukhya Mantri Krishi Ashirwad Yojana of Jharkhand.
• Rythu Bandhu of Telangana.
Agricultural Services and allied sectors
• Agricultural Trade: India occupies a leading position in global trade of agricultural products. However, its total agricultural export basket accounts for a little over 2.15 percent of the world agricultural trade.
o Major export destinations: USA, Saudi Arabia, Iran, Nepal and Bangladesh.
o Major Products: Rice (both Basmati and non-basmati), spices and cotton.
o Several Trade Policy Measures were undertaken by the Government-
✓ Protective measures like increasing Import duty on some products like peas, quantitative restrictions on Imports and providing a Minimum Import Price (MIP) for products like pepper.
✓ Restriction on export of pulses and edible oils has been majorly lifted.
✓ Creation of Agriculture Export Policy aimed at doubling the agricultural exports and integrating Indian farmers and agricultural products with the global value chains.
✓ Creation of ‘Agri Cells’ in many Indian embassies abroad to take care of agricultural trade related issues.
• Agricultural Research and Education: ICAR is the premier research organisation for coordinating, guiding and managing research and education in agriculture, including horticulture, fisheries and animal sciences.
o High Yielding Varieties and Breeder Seeds: A total of 220 new varieties/hybrids of field crops, 93 horticultural crops and 18 biofortified varieties of crops were notified / released during 2019-20.
Protection of Indigenous Breeds: About 184 indigenous breeds were registered in 2019. This will provide legal support for IPRs of the registered breed/new varieties released and conservation of threatened breed and indigenous breeds.
o Disease Protection of Livestock: For livestock protection, the diagnostic kits against Japanese Encephalitis (JE) and Bluetongue (BT) diseases and Subviral Particle based Infectious Bursal Disease Vaccine were developed.
o Transferring Technologies from Lab to Farmer’s Field: 716 Kisan Vikas Kendras (KVKs) of the country have been linked with 3.37 lakh common service centers to enhance their reach amongst the farmers and provide the demand driven services and information. KVKs conducted 42361 onfarm trials and 2.71 lakh Frontline Demonstrations
Allied Sectors:
• Animal Husbandry, Dairying and Fisheries: Livestock sector has grown at a compound annual growth rate of 7.9 per cent during last five years. Livestock income has become an important secondary source of income for rural families and has assumed an important role in achieving the goal of doubling farmers’ income.
o National Animal Disease Control Programme (NADCP) for FMD: This scheme envisages complete control of Foot and Mouth Disease (FMD) by 2025 with vaccination and its eventual eradication by 2030.
o Largest Milk Producer: India is the largest producer of milk in the world. Milk production in the country was 188 million tonnes in 2018-19 with a yearly growth rate of 6.5 percent resulting in increased per capita availability to 394 grams per day.
o Employment: According to NSSO’s 68th Round Survey on Employment and Unemployment, 16.44 million workers were engaged in the activities of farming of animals, mixed farming, fishing and aquaculture.
• Fisheries Sector: The sector provides livelihood to about 16 million fishers and fish farmers at the primary level and almost twice the number along the value chain.
o Independent Department: Recognising the importance of the sector, an independent Department of Fisheries has been created in 2019.
o Share in Agricultural GDP and export: The sector accounts for 6.58 percent of GDP from agriculture, forestry and fishing. Also, the sector is one of the major contributors of foreign exchange earnings with India being one of the leading seafood exporting nations in the world.
o Fish Production: The total fish production in the country was 13.42 million metric tonnes (MMT) during 2018-19. (Marine fisheries- 3.71 MMT and Inland fisheries- 9.71 MMT)
o Fisheries and Aquaculture Infrastructure Development Fund (FIDF): FIDF provides concessional finance/ loan to the Eligible Entities (EEs), including State Governments/UTs and State entities for development of identified fisheries infrastructure facilities.
✓ Concessional finance will be provided by the Nodal Loaning Entities (NLEs) namely
(i) NABARD,
(ii) National Cooperatives Development Corporation (NCDC) and
(iii) All scheduled Banks.
• Food Processing Sector: During the last 6 years ending 2017-18, Food Processing Industries sector has been growing at an average annual growth rate of around 5.06 per cent.
o Employment: According to the Annual Survey of Industries for 2016-17, the total number of persons engaged in registered food processing sector was 18.54 lakhs. (whereas unregistered FPOs supports 51.11 lakh workers)
o Pradhan Mantri Kisan Sampada Yojana (PMKSY): PMKSY provides subsidy-based support to create robust modern infrastructure for agriculture and agro-based industries along the entire value/supply chain.
✓ The scheme has various components like Mega Food Parks, Integrated Cold Chain and Value Addition Infrastructure, etc.
✓ The scheme is estimated to benefit about 46.37 lakh farmers and generate about 5.6 lakh direct/ indirect employment.
• Fertilizers: The New Urea Policy-2015 (NUP- 2015) had objectives of maximizing indigenous urea production; promoting energy efficiency in urea production; and rationalizing subsidy burden on the government.
o DBT System in Fertilizers: Under the fertilizer DBT system, 100 percent subsidy on various fertilizer grades is released to the fertilizer companies on the basis of actual sales made by the retailers to the beneficiaries.
✓ Sale of all subsidized fertilizers to farmers/buyers is being made through Point of Sale (PoS) devices and the beneficiaries will be identified through Aadhaar Card, KCC etc.
Food Management
The main objectives of food management are procurement of foodgrains from farmers at remunerative prices, distribution of foodgrains to consumers at affordable prices and maintenance of food buffers for food security and price stability.
• FCI undertakes storage and procurement of foodgrains, whereas foodgrains are distributed in accordance with National Food Security Act (NFSA), 2013.
o Coverage: NFSA provides for coverage of upto 75 percent of the rural population and upto 50 percent of the urban population for receiving foodgrains under Targeted Public Distribution System (TPDS). (Covering about 80 crore persons.)
o To ensure adequate availability of wheat and rice in central pool, Central
Government has taken several steps like encouraging Decentralized Procurement of wheat and rice, creating strategic reserves, undertaking Open Market Sale Scheme (OMSS) and PDS reforms.
o PDS reforms includes One Nation – One Ration Card, Aadhaar authenticated distribution through ePOS machines etc.
• Foodgrain Stocking Norms: Government has revised the Buffer Norms in January, 2015 and the nomenclature of Buffer Norms has been changed to Foodgrain Stocking Norms to meet the prescribed minimum stocking norms for food security, to ensure monthly releases of foodgrains for supply through the TPDS/ Other Welfare Schemes, to meet emergency situations arising out of unexpected crop failure, natural disasters etc. and to use the foodgrain stock in the Central Pool for market intervention to augment supply so as to help moderate the open market prices.
• Allocation of foodgrians under NFSA/TDPS: NFSA has been implemented in all States/UTs.
o Allocation: Collectively, about 604 lakh tonnes of foodgrains were allocated to States/UTs.
o Procurement Percentage: Procurement as a percentage of production was highest in the last five years at about 45 percent.
• Economic Cost of foodgrains to FCI: Economic Cost of foodgrains consists of three components- pooled cost of grains, procurement incidentals and the cost of distribution.
o Pooled Cost: The pooled cost of food grains is the weighted MSP of the stock of foodgrains available with FCI. It increased due to rise in the MSP of both rice and wheat.
o Real economic cost: Increase of one unit in real MSP leads to 0.48 unit increase in real economic cost procurement and the impact is significant.
• Food Subsidy: The difference between the per quintal economic cost and the per quintal Central Issue Price (CIP) gives the quantum of food subsidy.
o Composition of Subsidy: Food subsidy comprises of subsidy provided to FCI for procurement and distribution of wheat and rice and for maintaining the strategic reserve of foodgrains and subsidy provided to States for undertaking decentralized procurement.
o Increasing Subsidy: Food subsidy incurred by the Government has risen substantially over the years. (From about 0.6 lakh crore in 2009-10 to about 1.7 lakh crore in 2018-19).
o Reasons for increasing subsidy: There are several reasons like-
✓ The NFSA provides a wider coverage than the erstwhile TPDS.
✓ NFSA has made the Antyodaya CIPs uniformly applicable to all NFSA beneficiaries.
✓ APL/BPL categorization was done away with under NFSA.
✓ Build up of the foodgrain stocks much higher than their norms.
✓ Decline in average Central Issue Price (CIP) for APL households.
• Storage Capacity: Capacity available with FCI is part of warehousing capacity available with the Central Warehousing Corporation (CWC) and State Warehousing Corporations (SWCs) and capacity hired from private sector.
o Steps taken: To augment the capacity, government has taken several steps such as-
✓ Private Entrepreneurs Guarantee Scheme (PEG): Construction of godowns has been undertaken in PPP mode in 22 States.
✓ Central Sector Scheme (erstwhile Plan Scheme): This scheme is implemented in the North Eastern States along with few other states.
✓ Construction of Steel Silos: Creation of 100 LMT capacity in PPP mode for modernizing storage infrastructure and improving shelf life of stored foodgrains.
✓ Online Depot Management System (ODMS): It aims to automate the entire process of depot operations.
One Nation- One Ration Card
• The Department of Food & Public Distribution is implementing a Scheme namely Integrated Management of Public Distribution System (IM-PDS).
• The main objective of the scheme is to introduce nationwide portability of ration card holders under NFSA through ‘One Nation One Ration Card’ System, to lift their entitled foodgrains from any Fair Price Shop (FPS) in the country without the need to obtain a new ration card
• This system would largely benefit numerous migratory beneficiaries who frequently change their place of dwelling in search of work/employment or for other reasons across the country and eventually get deprived of their quota of subsidised foodgrains under NFSA due to migration from their native place.
Cyber-Agro Physical Systems (CAPS)
• This system envisages integrating the use of sensors with computers, satellite imagery and supercomputing in agricultural operations along with artificial intelligence enabled farmers’ advisories.
Initiatives by Department of Agricultural Research & Education (DARE)
• Agricultural Education Portal EKTA (Ekikrit Krishi Shiksha Takniki Ayaam) for integrated online management information system.
• It developed 9 mobile apps such as mango cultivation, e-kalpa etc.
• It developed 02 mobile Apps for farming community (Kisan Suvidha and Pusa Krishi)
Way Forward
• The realisation of the objective of doubling farmers’ income necessitates addressing of some of the basic but persistent challenges of agriculture and allied sector. Improvement in farm productivity through mechanization and micro-irrigation needs a balance with financial security of farmers through MSP, agricultural credit and crop insurance.
• In the longer-term, agricultural modernization can be effectuated only through agricultural research and education coupled with agricultural trade. To improve the robustness of agricultural supply chain, forward and backward linkages in the form of food processing and fertilizer sector need simultaneous reform.
• Since, agricultural growth affects and is affected by food security via policy channels like procurement policy. Thus, policy reforms and infrastructure development accompanied by rationalization of subsidies provide a framework for sustainable agricultural growth.
INDUSTRY AND INFRASTRUCTURE
Introduction
• Industrial sector performance is critical to achieving the ambitious goal of making India a five-trillion economy.
• Directly, the sector contributes close to 30 per cent of total gross value added (GVA) and indirectly it supports the other two sectors through forward and backward linkages.
Overview of Industrial Sector
• Decreased Growth: The estimated growth for 2019-20 is 2.5 percent as compared to 6.9 percent last year. (Reason being the 0.2 percent negative growth of manufacturing sector).
• Index of Industrial Production (IIP): The IIP is a measure of industrial performance. It assigns a weight of 77.6 percent to manufacturing followed by 14.4 percent to mining and 8.0 percent to electricity.
o IIP growth moderated: Overall, IIP growth moved to 3.8 percent in 2018-19 compared to 4.4 percent in 2017-18. Reasons being slower credit flow to MSMEs reduced lending by NBFCs, tapering of domestic demand for key sectors etc.
• Index of Eight Core Industries: It measures the performance of eight core industries i.e. Coal, Crude Oil, Natural Gas, Refinery Products, Fertilizers, Steel, Cement and Electricity. These Eight Core Industries comprise 40.27 percent weight in the IIP.
o Overall, the Index lays flat during 2019-20 (April- November) compared to corresponding figure of 5.1 percent last year.
• Correlation: The Survey observes that IIP, Eight Core Industries and Manufacturing sector from 2017-18 to 2019-20 move in tandem with some occasional deviation.
• Performance of Central Public Sector Enterprises (CPSEs):
o Profits: The overall net profit of the 249 operating CPSEs went up by 15.52 per cent.
o Investment: The increase in investment in all the CPSEs was 14.65 per cent in 2018-19 over 2017-18, and capital employed went up by 11.71 per cent over the same period.
• Corporate Sector Performance:
o Sectoral slowdown: Petroleum products, iron and steel, motor vehicles and other transport equipment companies were the major contributors to slowdown.
o Stable Capacity Utilization: The capacity utilisation of India’s manufacturing sector remains stable at 73.6 percent.
• Rising Gross Capital Formation (GCF): Rate of growth of GCF in industry has registered a sharp rise from – 0.7 percent in 2016-17 to 7.6 percent in 2017-18.
• Increased Credit Flow: Growth in gross bank credit flow to the industrial sector rose to 2.7 percent in September 2019 as compared to 2.3 percent in September 2018.
• Ease of doing business (EODB): India has improved to 63rd position (from 77th last year) among the 190 countries in the World Bank’s Doing Business 2020 Report. India has improved its rank in 7 out of 10 indicators which span the life-cycle of a business.
• Start-up India: As last estimated, 27,084 start-ups were recognized across 551 districts, 55 percent of which are from Tier I cities, 45 percent from Tier II and Tier III cities.
o Several steps have been taken to encourage start-ups:
✓ Exemptions from Income tax on investments raised by start-ups.
✓ Implementation of 32 regulatory reforms to improve Ease of Doing Business for startups.
✓ Self-certification regime for six labour laws and three environmental laws.
✓ Start-up India Hub as ‘One Stop Shop’ for the start-up ecosystem.
o Top 3 State performers: Maharashtra, Karnataka and Delhi.
o Major Sectors: IT Services (13.9 percent), Healthcare and Life Sciences (8.3 per cent) and education (7.0 percent).
• Foreign Direct Investment (FDI): Total FDI Equity inflows were US$26.10 billion as compared to US$22.66 billion during 2018-19.
o Major Destinations: Nearly 80 percent of all the FDI inflows have come from Singapore, Mauritius, Netherlands, USA and Japan.
Sector-wise issues and initiatives
• Steel: India stood at second position in the production of crude steel. (with 6 percent share in global production)
o Third largest consumer: It is also the third largest consumer of the finished steel after China and USA.
o Growth and Utilization: Crude steel production displayed a growth of 1.5 percent with utilisation capacity of 77.4 per cent.
• Coal: Overall production of raw coal in India during the year 2018-19 was 730.4 million tonnes (MT) growing at 8.1 percent.
o Large imports: 126.20 MT of coal was imported during April 2019 to September 2019.
• Micro, Small and Medium Enterprises (MSMEs): Central Government announced many key announcements for the sector
o In-principle approval for loans up to Rs. 1 crore within 59 minutes through online portal.
o Interest subvention of 2 per cent for all GST registered MSMEs on incremental credit up to Rs. 1 crore.
o All companies with a turnover of more than Rs. 500 crore to be mandatorily on TReDS platform.
o All CPSUs to compulsorily procure at least 25 per cent from MSEs instead of 20 per cent of their total purchases.
o Out of the 25 per cent procurement mandated from MSEs, 3 per cent reserved for women entrepreneurs.
o All CPSUs to compulsorily procure through GeM portal.
o 20 Technology Centres (TCs) and 100 Extension Centres (ECs) to be established at the cost of Rs. 6,000 crore.
• Textile and Apparels: Textiles contributed 18.0 per cent of manufacturing and 2.0 per cent of GDP in 2017-18.
o Exports: The share of textiles and clothing in India’s exports was 12 per cent in 2018- 19. Also, exports registered of growth of 3 percent in 2018-19 over 2017-18.
o Employment: The sector is the biggest employer after agriculture and it employs 4.5 crore people directly and 6 crore people in allied sectors.
o Production: Estimated man-made fibre and filament yarn production increased but cloth production decreased during April-August 2019.
Infrastructure
Since provision of adequate infrastructure is essential for growth and for making growth inclusive. Government has launched National Infrastructure Pipeline (NIP).
• National Infrastructure Pipeline: The objective of NIP is to create bouquet of well-prepared projects would attract investment from Central and State Governments, Urban Local Bodies, Banks and Financial Institution, PE funds, and private investors, both local and foreign.
o The NIP has projected total infrastructure investment of Rs. 102 lakh crore during the period FY 2020 to 2025 in India.
o NIP is expected to enable well-prepared infrastructure projects which will create jobs, improve ease of living, and provide equitable access to infrastructure for all.
• Other steps: NIP needs to be accompanied with other steps like developing a robust bond market for infrastructure companies, speedy resolution of infrastructure disputes, optimal risk sharing through better and balanced PPP contracts, and sanctity and enforceability of contracts.
Sectoral Developments
• Roads Sector: The share of transport sector in the GVA for 2017-18 was 4.77 per cent of which the share of road transport is the largest at 3.06 per cent, followed by the share of the Railways (0.75 per cent), air transport (0.15 per cent) and water transport (0.06 per cent).
o Traffic: As per the National Transport Development Policy Committee Report, road transport is estimated to handle 69 percent and 90 percent of the countrywide freight and passenger traffic, respectively.
o Road Network: India has a road network of about 59.64 lakh km. The total length of National Highways was 1.32 lakh km.
o Pace of construction: Grew significantly from 17 kms per day in 2015-16 to 29.7 kms per day in 2018-19.
o Investment: Total investment in the Roads and Highway sector has gone up more than three times in five year period of 2014-15 to 2018-19.
• Railways: Indian Railways (IR) with over 68,000 route kms is the third largest network in the world under single management.
o Traffic: Indian Railways carried 120 crore tonnes of freight and 840 crore passengers making it the world’s largest passenger carrier and 4th largest freight carrier. (Revenue Earning Freight and Passenger Traffic grew at 5.34 percent and 1.85 percent respectively.)
o Decrease in accidents: During 2018-19, consequential train accidents decreased from 73 to 59 in comparison to the corresponding period of the previous year.
o Swachh Rail, Swachh Bharat: Number of bio-toilets has increased from about 20,000 in 2015 to 2.25 lakh in 2019. Also, there has been substantial increase in mechanized cleaning contracts and plastic bottle crushing machines.
o Modernization of stations: 1,253 stations have been identified for development under Adarsh Station Scheme and a dedicated SPV, Indian Railway Station Development Corporation (IRSDC) Limited has been set up for the purpose.
• Civil Aviation: India is the third largest domestic market for civil aviation in the world.
o Increase in aircraft seat capacity: Airlines in India have scaled up their aircraft seat capacity from an estimated 0.07 annual seats per capita in 2013 to 0.12 in 2018.
o Traffic: The total passenger traffic (domestic and international) and air cargo handled at airports from 2014-15 to 2018-19 to 3447 lakh and 3,562,000 tonnes respectively.
o Udaan Scheme: A total of 43 airports have been operationalized since Udaan scheme was takenup.
o Capacity Expansion: To ease the strain on existing airport capacities, 100 more airports are to be made operational by FY 2023-24.
o Reforms: To boost the sector, government has envisaged reforms like-
✓ Easing leasing and financing from Indian shores in conformance with the provisions of the Cape Town Convention and Protocol on Aircraft Equipment.
✓ Encouraging domestic and international passenger and goods transfers.
✓ Efficient use of air traffic rights and rationalizing the tax regime.
• Shipping: Around 95 percent of India’s trade by volume and 68 percent in terms of value is transported by sea.
o Low Shipping Tonnage: India’s share in total world dead weight tonnage (DWT) is only 0.9 percent. (Despite having a large fleet strength of 1,419 ships).
o Aging Fleet: Average age of Indian fleet has increased from 15 years in 1999 to 19.71 years in 2019.
o The Major Ports in the country have an installed capacity of 1,514.09 MTPA as in March, 2019 and handled traffic of 699.09 MT during 2018-19. While increasing the capacity of major ports, Ministry of Shipping has been striving to improve the operational efficiencies through mechanization, digitization and process simplification.
• Telecom Sector: Total telephone connections in India grew by 18.8 per cent from 9,961 lakh in 2014-2015 to 11,834 lakh in 2018-19.
o Connection Composition: The wireless telephony now constitutes 98.27 percent of all subscriptions whereas share of landline telephones now stands at only 1.73 percent.
o Tele-density: The overall tele-density in India stands at 90.45 per cent, the rural tele-density being 57.35 per cent and urban tele-density being 160.71 per cent.
o Increased internet subscribers: The number of internet subscribers stood at 6,653 lakh as compared to 2,516 lakh in 2014. Among them, the number of mobile internet subscribers was 6,436 lakh.
o Leader in data consumption: India’s monthly data consumption is the highest, with average consumption per subscriber per month increasing 157 times from 2014 to 2019.
o Tariff War: Since 2016, the sector has witnessed substantial competition and price cutting by the Telecom Service Providers (TSPs) creating financial stress in the sector.
• Telecom Infrastructure and connectivity
o Bharat Net: It aims to provide broadband connectivity to all the 2.5 lakh Gram Panchayats (GPs) in the country.
o Public Wi-Fi Access: Public Wi-Fi hotspots ensure last-mile delivery of broadband to users.
o Towers and BTS: The number of Mobile Base Transceiver Stations (BTS) has increased from 7.9 lakh in 2014 to 21.8 lakh 2019 while Optical Fibre Cable has increased from 7 lakh km to around 14 lakh km.
o Project for LWE Areas and North East Region: It aims at providing Mobile Services in 2,335 locations affected by Left Wing Extremism (LWE).
• Petroleum and Natural Gas: India is the third largest energy consumer in the world after USA and China. (With a share of 5.8 per cent of the world’s primary energy consumption.)
o Oil Production: India’s oil production is one of the lowest among the major economies of the world and has been declining over a period of time.
✓ This reduction in production can be attributed to natural decline in ageing and matured fields and no major discoveries.
o Large Refining Capacity: India with a refining capacity of 249.4 MMTPA is the fourth largest in the world after the United States, China and Russia.
✓ Fall in Capacity Utilization: Refinery capacity utilisation fell to 103.9 per cent in 2018-19, compared to 107.7 per cent in 2017-18.
o Natural Gas: Domestic production of natural gas has been increasing since 2017-18 and is estimated to be 31.8 billion cubic metres (BCM) in 2019-20.
o Dominated by PSUs: Since the sector is dominated by PSEs, Government has taken several reforms to encourage private sector participation such as:
✓ Simplified fiscal and contractual terms.
✓ Bidding of exploration blocks under Category II and III sedimentary basins without any production or revenue sharing to Government.
✓ Early monetization of discoveries by extending fiscal incentives.
✓ Incentivizing gas production including marketing and pricing freedom.
• Power: lndia has improved its ranking to 76th position in the Energy Transition Index published by the World Economic Forum (WEF) suggesting paradigm shift in the sector.
o Capacity: Thermal power accounts for about 63 percent (with renewable energy- 23 percent and Hydro- 12.4 percent) of total installed capacity and roughly half of the generation capacity is in the private sector.
o Pradhan Mantri Sahaj Bijli Har Ghar Yojana (Saubhagya): 18 States have reported supply of more than 20 hours of electricity supply while remaining states have reported about 15 or more hours.
This is a significant achievement.
• Mining Sector: India produces as many as 95 minerals which include 4 hydrocarbon energy minerals, 5 atomic minerals (ilmenite, rutile, zircon, uranium, and monazite).
o Contribution: Mining and quarrying sector contribution to GVA accounted for about 2.38 per cent during 2018-19.
o Increased Production: The production of major minerals during the year 2018-19 has recorded a growth of 25 per cent when compared to last year in terms of value.
o Index of Mineral Production: The Index of Mineral Production (base 2011-12 = 100) for the year 2018-19 is estimated to be 107.9 as compared to 104.9 of previous year.
• Housing and Urban Infrastructure: There were about 37.7 crore people residing in the urban habitats of India (Census 2011), comprising about 31 per cent of the total population which is expected to reach 60.6 crore by 2030 (2015: UN).
o Construction Sector: The construction sector accounts for 8.2 per cent of GDP which includes housing and employs about 12 per cent of the workforce.
o PMAY (U): It aims to achieve the goal of ‘Housing for all’ by 2022.
✓ Performance: Out of 1.03 crore houses approved, 60 lakhs have been grounded for construction, of which 32 lakh houses have been completed and delivered.
✓ High Participation: The function of beneficiary identification based on eligibility criteria has also been entrusted to States/UTs. Such flexibility has resulted in greater participation of the States/UTs and the citizens.
✓ Funding: A separate fund has been created namely National Urban Housing Funds (NUHF) along with funding mechanisms NHB and refinancing of HFCs.
✓ Verticals: PMAY is being implemented in multiple verticals.

✓ Smart Cities Mission (SCM): All 100 cities under Smart City Mission have incorporated Special Purpose Vehicles (SPVs), City Level Advisory Forums (CLAFs) and appointed Project Management Consultants (PMCs).
Way Forward
• To achieve the GDP of $5 trillion by 2024-25, India needs to spend about $1.4 trillion on infrastructure.
• The National Infrastructure Pipeline (NIP) captures the infrastructure vision and creates a base for sustainable industrial growth.
• This needs to be blended with adoption of Industry 4.0 for faster, smoother and more inclusive growth.
SERVICES SECTOR
Overview of the Services Sector
• Share in India’s Gross Value Added (GVA): Services sector contributes around 55 percent to total GVA as well as to total GVA growth.
o Moderation in growth: services sector growth (Year on Year) continued to moderate during 2019- 20, reaching 6.9 percent from 7.5 percent in 2018-19.
o Sector-wise growth: Growth of financial services, real estate, professional services, trade, hotels, transport and communication & broadcasting services decelerated whereas public administration, defence & other services witnessed acceleration.
o Decelerating Bank Credit: Growth in bank credit to the services sector has continued to decelerate from 28.1 percent as on November 2018 to 4.8 percent on November 2019.
• Contribution in GSVA: Services sector accounts for more than 50 per cent of the Gross State Value Added (GSVA) in 15 out of the 33 states and UTs. Chandigarh and Delhi stand out with a particularly high share of services in GSVA of more than 80 percent while Sikkim’s share remains the lowest at 26.8 percent.
• Gross FDI inflows increased: Gross FDI equity inflows jumped by 33 per cent Year on Year during April-September 2019 to reach US$ 17.58 billion, accounting for about two-thirds of the total gross FDI equity inflows into India during this period.
• Trade in Services: Export
o Maintained Services Exports Growth: Services exports maintained their growth at 6.4 percent. (Almost equal to 6.6 percent last year (2018-19)).
o Growth Composition: The jump in export growth of travel, software, business and financial services offset the contraction in export growth of insurance and other services.
o Software exports dominate: India’s services exports remain concentrated in software services accounting for almost 40 percent of total exports.
o Issues faced by Software Sector: Software sector faces problems like changes in exchange rate, changes in global IT spending, stringent USA visa norms, and rising cost pressures due to increased local hiring in export destinations.
• Trade in Services: Import
o Increased Services Imports Growth: Services import growth was 7.9 per cent (as compared to 7.3% last year (2018-19)).
o Growth Composition: An increase in import growth for transport, software, communication and business services offset the contraction in imports of financial and insurance services and the slowdown in imports of travel services.
o High Education imports: India persistently runs a trade deficit in education services with education imports, reaching about US$ 3 billion in 2018-19.
• Net Exports and Way Forward
o Net exports increased: Net exports of services increased from US$ 38.9 billion during April-September 2018 to US$ 40.5 billion during April- September 2019, up 4.1 percent.
o Possible recovery in 2020: World trade volume for goods and services are projected to recover in 2020 following a deceleration in 2019.
o Challenges ahead: Global uncertainty, protectionism and stricter migration rules would be key factors in shaping India’s services trade ahead.
• India in World Commercial Services Export
Increase in global share of services: While merchandise exports were growing faster than commercial services exports during 2005-11, commercial services exports have outperformed goods exports during 2012-18.
• Capitalization by India
Consequently, India’s share in world’s commercial services exports has risen steadily over the past decade to reach 3.5 percent in 2018, twice the share in world’s merchandise exports at 1.7 per cent.
India now ranks 8th among the world’s largest commercial services exporters.
Sub-sector wise performance and recent polices
Most of the sub-sectors of the services sector witnessed a moderation in growth during 2019-20 including sectors like tourism, ports sector etc.
• Tourism sector: The sector witnessed a strong performance from 2015 to 2017, with high growth in foreign tourist arrivals. However, foreign tourist arrivals growth (Year on Year) has decelerated since then.
o Slow global growth: Growth in international tourist arrivals globally also slowed from 7.1 per cent in 2017 to 5.4 per cent in 2018.
o India’s Share in International Tourist Arrivals (ITAs): India ranked 22nd in the world in terms of ITAs in 2018, improving from the 26th position in 2017. India now accounts for 1.24 per cent of world’s international tourist arrivals and 5 per cent of Asia & Pacific’s international tourist arrivals.
o Country profile of tourists: Foreign tourists from the top 10 countries visiting India – Bangladesh, USA, UK, Sri Lanka, Canada, Australia, Malaysia, China, Germany and Russia – accounted for 65 percent of the total foreign tourist arrival in India. Majority of them (62.4%) visited India for leisure, holiday and recreation.
o Preferred Destinations: Top five states attracting foreign tourists are Tamil Nadu, Maharashtra, Uttar Pradesh, Delhi and Rajasthan, accounting for about 67 percent of the total foreign tourist visits.
o E-Visa scheme to encourage foreign tourists: The e-Visa scheme is now available for 169 countries with valid entry through 28 designated airports and 5 designated seaports. With this, foreign tourist arrivals to India on e-visas have increased from 4.45 lakh in 2015 to 23.69 lakh in 2018.
• IT-BPM Services: The sector contributes significantly to the economy via employment growth and value addition. It constitutes the sectors IT Services, Business Process Management (BPM), Hardware and Software Products and Engineering Services.
o IT Services dominant: IT services constituted 51 percent share of the IT-BPM sector in 2018-19. Out of the IT services, digital revenues grew (Year on Year) more than 30 percent.
o Export driven: A significant part (about 83 per cent) of the IT-BPM industry (excluding hardware) continues to be export driven.
o Decreased revenue growth: During 2018-19, the revenue growth for IT-BPM sector (excluding hardware) softened to 6.8 per cent from 8.2 per cent in 2017-18.
o IT-BPM export composition: USA accounts for the bulk of exports which is 62 per cent of total ITBPM exports (excluding hardware) in 2018- 19. This is followed by UK with 17 percent of the total exports.
o Policy initiatives in the sector: A number of policy initiatives have been undertaken to drive innovation and technology adoption in the IT-BPM sector, including Start-up India, National Software Product Policy, and removal of issues related to Angel Tax.
• Port and Shipping Services: India has 13 major ports and about 200 minor ports. Growth in overall port traffic witnessed an acceleration between 2013-14 and 2016- 17, but has decelerated since 2017-18
o Port Capacity: The total cargo capacity of Indian ports stood at 1,452 Million Tonnes Per Annum (MTPA) at the end of FY18.
o Share in world’s fleet: India has a 0.9 per cent share in world fleet as on January 2019.
o Most important ports: Ports such as Paradip, Chennai, Vishakhapatnam, Deendayal (Kandla) and JNPT had the highest cargo capacities
o Halving of turnaround time: The turnaround time of ships, which is a key indicator of efficiency of the ports sector, has been on a continuous decline, almost halving between 2010-11 and 2018-19 to 2.48 days. (But there is scope of improvement as median ship turnaround time globally is 0.97 days)
• Space Sector: India’s space programme has grown exponentially since its modest beginnings. It includes launch vehicle development, satellite technologies, telecommunication, navigation etc.
o Low spending vis-à-vis global players: India spent about US$ 1.5 billion on space programmes in 2018. But it still lags behind that of the major players such as USA and China, which spent about 13 times and 7 times more than India respectively.
o High success rate: India has launched around 5-7 satellites per year in the recent years with no failures, barring one in 2017.
o Key areas of focus-
✓ Satellite Communication: INSAT/GSAT satellite system acts as the backbone to address the needs for telecommunication, broadcasting and satellite-based broadband infrastructure.
✓ Earth Observation: It is done through space-based information for weather forecasting, disaster management, national resource mapping and governance.
✓ Satellite-aided Navigation: It includes both GAGAN and NavIC. GAGAN augments GPS coverage of the region to improve accuracy and integrity for civil aviation. Whereas, NavIC is a regional navigation system for Position, Navigation and Timing (PNT) Services.
o Attracting Private Investment: In the light of the growing number of satellite and launch vehicle missions and application programmes, several areas have been identified for participation of private sector; such as production of PSLV, satellite integration and assembly, production of composite materials and propellants and creating testing and evaluation systems for avionics.
SOCIAL SECTOR AND HUMAN RESOURCES
Introduction
• Investment in social infrastructure is a pre-requisite for inclusive growth, employment and sustainable development.
• This chapter highlights the important developments in the social sector, takes stock of the outcomes and highlights issues relevant for the policy in the sector.
Trends in the social sector expenditure
• The expenditure on social services (education, health and others) by Centre and States as a proportion of Gross Domestic Product (GDP) increased by 1.5 percentage points from 6.2% in 2014-15 to 7.7 per cent in 2019-20.
• An increase was witnessed across all social sectors during this period viz Education (2.8% to 3.1%) and Health (1.2% to 1.6%).
Human Developments
• India’s rank in the Human Development Index (HDI) improved to 129 in 2018 from 130 in 2017.
• With 1.34 per cent average annual HDI growth, India is among the fastest improving countries, and ahead of China (0.95), South Africa (0.78), Russian Federation (0.69) and Brazil (0.59).
Education for all
• As per Unified District Information System for Education (U-DISE, 2017-18), which collects data on various indicators on school education, among Government elementary schools, 98.38 % have girls’ toilet, 96.23 % have boys’ toilet, 97.13 % have provision of drinking water facility, 38.62 % have ramps, 58.88 % have boundary wall, 56.72 % have playground facility, 79.23 % have library and 61.75 % are having electricity connection.
• As per National Sample Survey (NSS) Report, 2017-18,
o Drop-out rate was 10 per cent at primary level, 17.5 per cent at upper primary/middle and 19.8 per cent at secondary level.
o 13.6 per cent persons of age 3 to 35 years have never enrolled citing reasons as ‘not interested in education’ and ‘financial constraints.’
• Among various components of expenditure on education, expenditure on course fees is the highest which is 50.8 per cent at all India level (including tuition, examination, developmental fees and other compulsory payments) followed by books, stationary and uniform; transport; Private coaching; and other expenses.
• Due to absence of competition in government schools/institutions, quality of education in government schools/institutions is low. As a result, more and more students prefer to enrol themselves in private institutions where they spend significantly higher as compared to government institutions across rural-urban India.
Initiatives taken to provide the quality education in government schools and institutions
• Samagra Shiksha w.e.f. 2018-19, which subsumes three erstwhile Centrally Sponsored Schemes of Sarva Shiksha Abhiyan (SSA), Rashtriya Madhyamik Shiksha Abhiyan (RMSA) and Teacher Education (TE) envisages school education as a continuum from pre-school to senior secondary level and aims to ensure inclusive and equitable quality education.
• To improve quality of education– Central RTE Rules have been amended to include reference on class-wise and subject-wise Learning Outcomes in order and the RTE Act, 2009 was amended in 2017 to ensure that all teachers acquire the minimum qualifications prescribed under the Act.
• The Navodaya Vidyalaya Scheme provides for opening of one Jawahar Navodaya Vidyalaya (JNV) in each district of the country to bring out the best of rural talent, and provide them quality education comparable to the best in a residential school system.
• NISHTHA – National Initiative for School Heads’ and Teachers’ Holistic Advancement under the Centrally Sponsored Scheme of Samagra Shiksha to build the capacities of around 42 lakh teachers and head of schools, faculty members of SCERTs, DIETs, Block Resource Coordinators, and Cluster Resource Coordinators by training them to encourage and foster critical thinking in students, handle diverse situations and act as first level counsellors.
• The National Curriculum Framework that promotes joyful learning through cultural activities including art, music, dance and theatre is playing a very critical role in a student’s life and school activities.
• Pradhan Mantri Innovative Learning Program (DHRUV) was launched to identify and encourage talented students to enrich their skills and knowledge.
• (DIKSHA) platform to broadbase technology aided teaching and learning. Other e-content sites like e-pathsala, National Repository of Open Educational Resources (NROER) are also being integrated with DIKSHA to ensure easy access.
• New Education Policy to meet the changing dynamics of the requirements of the population with regard to quality education, innovation and research, aiming to make India a knowledge superpower by equipping its students with the necessary skills and knowledge and to eliminate the shortage of manpower in science, technology, academics and industry.
Initiatives taken for improving the quality of learning and teaching in higher education
• Pandit Madan Mohan Malaviya National Mission on Teachers and Teaching (PMMMNMTT) which aims at building a strong professional cadre of teachers by setting performance standards and creating top class institutional.
• Higher Education Financing Agency (HEFA) to provide sustainable financial model for higher education institutions, Kendriya Vidyalayas, Navodaya Vidyalayas, AIIMS and other educational institutions of the Ministry of Health. Under it, projects worth 37,001.21 crore have been approved and the 75 educational institutions have availed funding through the agency.
• National Educational Alliance for Technology (NEAT) scheme promoting use of Artificial Intelligence to make learning more personalised and customised as per the requirements of the learner.
• Education Quality Upgradation and Inclusion Programme (EQUIP), a five year vision plan aiming at ushering transformation in India’s higher education system by implementing strategic interventions in the sector over the next five years (2019-2024).
• SWAYAM 2.0 to offer online degree programmes with enhanced features and facilities by top ranking universities.
• Deeksharambh’ and ‘PARAMARSH’ scheme by Dept of Higher Education to mentor institutions seeking National Assessment and Accreditation Council accreditation.
Skill Development
• General education improves knowledge of the people while skill training enhances their employability and equip them to tackle requirements of labour market.
• According to the Periodic Labour Force Survey (PLFS) 2017-18 only 13.53 per cent of the workforce in the productive age- group of 15-59 years has received training that includes 2.26 per cent formally trained and 11.27 per cent informally trained.
o Formal training is highest in the states such as Tamil Nadu, Maharashtra and West Bengal and lowest in Bihar, Jharkhand and Assam. Informally trained is highest in Chattisgarh, Uttar Pradesh and West Bengal and about 55.9 per cent received it either through self-learning or hereditary.
• Initiatives taken for skill development:
o Under the Skill India Mission, the Government implements the Pradhan Mantri Kaushal Vikas Yojana (PMKVY) which enables large number of prospective youth to take up Short Term Training (STT) and Recognition of Prior Learning (RPL) through empanelled training centers. Under it, 69.03 lakh candidates have been trained throughout the country and 30.21 lakh candidates under STT were certified.
o A wide range of reforms has been introduced to the Apprenticeship Rules, 1992 for expansion and outreach of apprenticeship policy.
Status of Employment in India
• As per PLFS estimates, between 2011-12 and 2017-18,
o The share of regular wage/salaried employees has increased by 5 % points in rural and urban areas. Under it, the proportion of women workers have increased by 8 % points.
o In absolute terms, there was a significant jump of around 2.62 crore new jobs in the above category with 1.21 crore in rural areas and 1.39 crore in urban areas with addition of 0.71 crore new jobs for female workers.
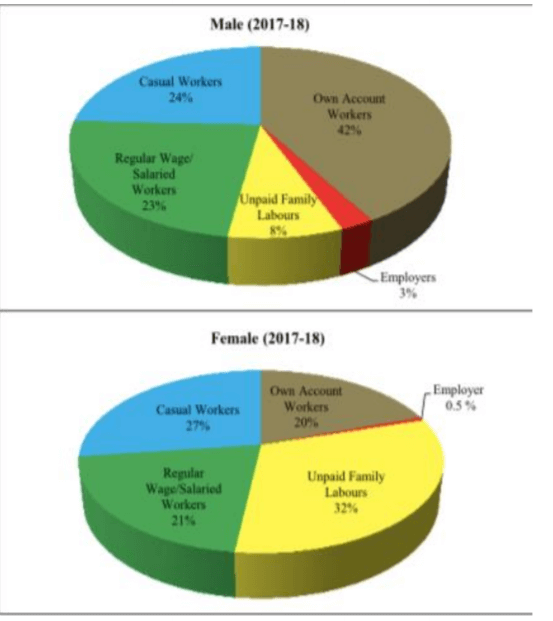
o Among the self-employed category (consists of employers, own account workers and unpaid family labour), while the proportion of own account workers and employers increased, the proportion of unpaid family labour (helper) has declined, especially for females. The proportion of total selfemployed workers however remained unchanged at 52 per cent.
o The distribution of workers in casual labour category decreased by 5% in rural areas.
• Various steps are being taken for generating employment in the country like encouraging private sector of economy, fast-tracking various projects involving substantial investment and increasing public expenditure on schemes such as Prime Minister’s Employment Generation Programme (PMEGP), Mahatma Gandhi National Rural Employment Guarantee Scheme (MGNREGS), Pt. Deen Dayal Upadhyaya Grameen Kaushalya Yojana (DDU-GKY) and Deendayal Antodaya Yojana-National Urban Livelihoods Mission (DAY-NULM).
Formalisation of Jobs
• It was observed that the proportion of workers in organized sector increased from 17.3 per cent in 2011- 12 to 19.2 per cent in 2017-18 with total 9.05 crore workers in the organized sector.
• Total formal employment in the economy also increased from 8 per cent in 2011- 12 to 9.98 per cent in 2017-18 with total 4.7 crore workers in formal employment in 2017-18.
• As per NSO-EUS and PLFS 2017-18 data, the of share of workers in informal sector in non-agricultures and AGEGC (Agricultural sector excluding only growing of crops, market gardening, horticulture and growing of crops combined with farming of animals) also show a decline from 77.5 per cent in 2004-05 to 68.4 per cent in 2017-18, with the decline being more pronounced among females.
Steps Taken Towards Formalisation of the Labour Market
• EPFO launched a “Universal Account Number” service for portability of Provident Fund accounts.
• Under Pradhan Mantri Rozgar Protsahan Yojana (PMRPY), Government is paying 12 per cent of employer contribution to EPFO in respect of the new employees drawing salary up to Rs 15,000 per month for the first three years of their employment.
• The Code on Wages Act, 2019 to ensure minimum wages to all and timely payment of wages to all employees irrespective of the sector of employment without any wage ceiling, except MGNREGA.
• MUDRA and STAND-UP India for creating formal credit to businesses.
• Mandatory wage ceiling of subscription to EPS increased from Rs 6,500 to Rs 15,000 per month and Rate of ESI contribution reduced from 6.5 per cent to 4 per cent.
• National Career Service (NCS) Project launched in 2015, provides a host of career-related services such as dynamic job matching, career counselling, job notifications and information on skill development courses and rich career content on a digital platform.
Female Participation in Labour Market
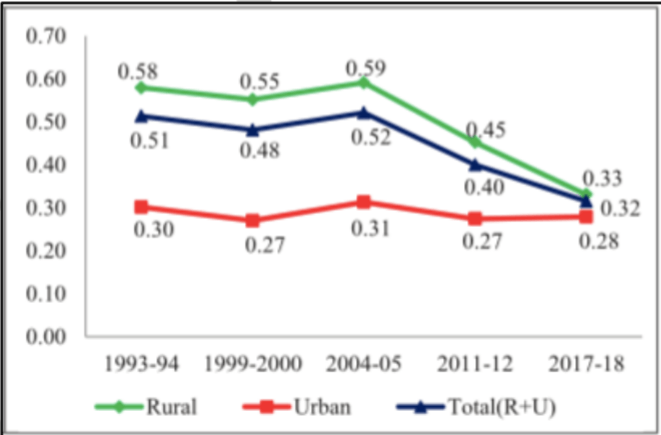
o According to NSO-EUS and PLFS estimates, female labour force participation rate (LFPR) for productive age-group (15- 59 years) declined by 7.8 % from 33.1 % in 2011-12 to 25.3 % in 2017-18 and rate of decline is sharper in rural areas as compared to urban areas.
o As a result of this, gender disparity in India’s labour market has increased.
Initiatives to Improve Female Work Participation
• Safety of Women at Workplace: The Sexual Harassment of Women at Workplace (Prevention, Prohibition and Redressal) Act, 2013 covers all women, irrespective of their age or employment status and protects them against sexual harassment at all workplaces both in public and private sector, whether organized or unorganized.
• Mahila Shakti Kendra Scheme to empower rural women through community participation.
• Provision of safe and affordable accommodation: To provide safe and affordable accommodation to working women, Working Women Hostels have been established
• Women Helpline Scheme (WHL): to provide 24 hours emergency and non-emergency response to women affected by violence through referral and information about women related government schemes/programmes across the country through a single uniform number (181).
• One Stop Centre (OSC): facilitates access to an integrated range of services including police, medical, legal, psychological support and temporary shelter to women affected by violence.
• Female Entrepreneurship: To promote female entrepreneurship, the Government has initiated schemes like: MUDRA, Stand Up India and Mahila e-Haat.
• Pradhan Mantri Mudra Yojana (PMMY) provides access to institutional finance to micro/small business units upto Rs 10 lakh.
• Rashtriya Mahila Kosh provides micro-credit at concessional terms to poor women for various livelihood and income generating activities.
• Prime Minister’s Employment Generation Programme (PMEGP): Under the scheme, women entrepreneurs are provided 25 per cent and 35 per cent subsidies for the project set up in urban and rural areas respectively.
• Deendayal Antyodaya Yojana– National Rural Livelihoods Mission (DAY-NRLM) – seeks to reach out to 8-9 crore rural poor households and organize one-woman member from each household into affinity-based women SHGs and federations at village and at higher levels.
Health for all
• The focus of healthcare is on four important pillars – preventive healthcare, providing affordable healthcare, building medical infrastructure and mission mode interventions.
• Preventive Health Care
o Under Mission Indradhanush, 3.39 crore children and 87.18 lakh pregnant women in 680 districts across the country have been vaccinated.
o Adoption of a multi-sectoral approach and increasing synergy with other Mission Mode initiatives of the Government such as Eat Right & Eat Safe, Fit India, Anaemia Mukt Bharat, Poshan Abhiyan and Swacch Bharat Abhiyaan etc.
o Government recently banned all commercial operations in e-cigarettes recognising the threat of nicotine addiction among youth and children.
• Health Care Affordability
o As per the National Health Accounts (NHA) 2016-17, the out of pocket expenditure (OoPE) as a percentage of total health expenditure has declined from 64.2 % in 2013-14 to 58.7 % in 2016-17.
o The National Health Policy, 2017 recommended to spend at least two third of Government’s health expenditure on primary healthcare (which accounts for 52.1 % of India’s current public expenditure on health)
o Initiatives like Ayushman Bharat– Pradhan Mantri Jan Arogya Yojana (PM-JAY), Free Drugs Service, Free Diagnostics Service , Pradhan Mantri Bharatiya Jan Aushadi Pariyojana (PMBJP) and Pradhan Mantri National Dialysis Programme (PMNDP) addresses the issue of high OoPE on account of drugs and hospital care.
• Medical Infrastructure
o The doctor-population ratio in India is 1:1456 against the WHO recommendation of 1:1000. To address the shortage of doctors, the government has embarked on an ambitious programme for upgradation of district hospitals into medical colleges.
o In last 5 years, government has sanctioned 141 new medical colleges and the number of MBBS and PG seats have increased by 27,235 and 15,000 respectively.
o The Pradhan Mantri Swasthya Suraksha Yojana (PMSSY) was launched to augment the tertiary healthcare capacity in clinical care, medical education and research in underserved areas of the country, under which AIIMS like institutions are built and Government Medical Colleges are upgraded by setting-up Super Speciality Blocks.
o National Medical Commission Act, 2019 was promulgated to enable constitution of National Medical Commission along with introduction of a common entrance test NEET-UG for admission to all MBBS courses including AIIMS and JIPMER.
o Multi-skilling of doctors at strategically located facilities identified by the States where there is shortage of specialists e.g. MBBS doctors are trained in Emergency Obstetric Care, Life Saving Anesthesia Skills and Laparoscopic Surgery.
o Capacity building of nursing staff and ANMs and co-location of AYUSH services in health facilities such as PHCs, CHCs and DHs.
• Mission Mode Interventions
o Ayushman Bharat targets universal health coverage by focusing on preventive, promotive and palliative care apart from ambulatory care; and by providing protection against catastrophic health expenditure for secondary and tertiary hospital care.
o It recognizes and addresses the emerging challenges of NCDs due to changing epidemiology and also targets to sustain the efforts for RMNCH+A and communicable diseases through initiatives such as as Surakshit Matritva Aashwasan (SUMAN), Social Awareness and Action to Neutralise Pneumonia Successfully (SAANS) and TB Harega Desh Jeetega.
o Several states have also initiated the use of digital platforms such as ECHO for continuous capacity building of the primary health team.
Housing for all
• As per recent NSO survey in 2018, about 76.7% of the households in the rural and about 96.0 % in the urban areas had the house of pucca structure.
• Pradhan Mantri Awaas Yojana-Gramin (PMAY-G) and Pradhan Mantri Awaas Yojana-Urban (PMAY-U) are two important schemes for achieving the target of housing for all by 2022.
Drinking water and Sanitation
• Since the launch of the SBM-G in 2014, over 10 crore toilets have been built in rural areas; over 5.9 lakh villages, 699 districts, and 35 States/UTs have declared themselves Open Defecation Free (ODF).
• Jal Shakti Abhiyan was launched to accelerate progress on water conservation activities in the most water stressed blocks and districts of India. It has delivered over 3.5 lakh water conservation measures in 256 districts out of which, 1.54 lakh are of water conservation and rain water harvesting measures,
20,000 relate to the rejuvenation of traditional water bodies, over 65,000 are reuse and recharge structures and 1.23 lakh are watershed development projects.
Conclusion
o Considering India’s demographic advantage of a large young population in the productive age group, improvements in the social sectors like education, health care, water supply and sanitation leaves a profound impact on the quality of life of the people as well as productivity of the economy.
o India’s march towards achieving SDGs is firmly anchored in investing in human capital and inclusive growth.