ECONOMY SURVEY REVIEW PART I
Contents
1. State of the Economy
2. Fiscal Developments
3. External Trade
4. Pricing and Inflation
5. Ease of Doing Business
6. Banking Sector
7. Disinvestment & Privatization
I. STATE OF THE ECONOMY
Global Economy in 2019-20
• The global output growth has been estimated to decline to 2.9 per cent in 2019 (from 3.6 per cent in 2018 and 3.8 per cent in 2017) (The World Economic Outlook (WEO) IMF).
• This is the slowest global output growth since the global financial crisis of 2009, arising from a geographically broadbased decline in manufacturing activity, trade and demand, whose major reasons are
o Uncertainty due to trade tensions between China and the USA, rising USA-Iran geo-political tensions and increasing trade barriers.
o Muted inflation in advanced and emerging economies reflecting a slack in consumer demand.
o Sharp fall in global production in automobile industry due to a decline in demand, which was caused by changes in technology and emission standards in many countries.
o in growth of manufacturing exports from major economies.
• India also experienced a downturn in the auto industry and manufacturing exports.
Indian Economy in 2019-20
Size of the economy
• The WEO of October 2019 has estimated India’s economy to become the fifth largest in the world, as measured using GDP at current US$ prices, moving past United Kingdom and France.
• The size of the economy is estimated at US$ 2.9 trillion in 2019.
• Given India’s record of growth with macroeconomic stability over the last five years (annual average growth rate of 7.5 per cent and annual average inflation of 4.5 per cent), the economy is poised for a rebound towards the US$ 5 trillion goal by 2024-25.
GVA and GDP growth in 2019-2020
• India’s GDP is estimated to have grown at 4.8 per cent in the first half (April- September) of 2019- 20, lower than 6.2 per cent recorded in the second half (October-March) of 2018-19.
• On the supply side, the deceleration in GDP growth has been contributed generally by all sectors save ‘Agriculture and allied activities’ and ‘Public administration, defence, and other services’.
• On the demand side, the deceleration in GDP growth was caused by a decline in the growth of real fixed investment induced in part by a sluggish growth of real consumption.
First Advance Estimates: 2019-20
• As per First Advance Estimates, growth in real GDP during 2019-20 is estimated at 5.0 per cent, as compared to the growth rate of 6.8 per cent in 2018-19.
• The growth in nominal GDP is estimated at 7.5 per cent over the provisional estimates of GDP for 2018-19.
Estimated trends in 2019-20 vis-à-vis 2018-19
• The contribution of total consumption and net exports in GDP at current prices are estimated to increase.
• Fixed investment as percentage of GDP at current prices and growth of real GVA at basic prices is estimated to decrease.
• Deceleration in GVA growth is estimated across all subsectors except ‘Public administration, defence and other services’.
The Recent Growth Deceleration: Drag of the Financial Sector on the Real Sector
The Slowing Cycle of growth
• When the virtuous cycle of growth rotates slowly, declining rate of fixed investment decelerates GDP growth with a lag, which eventually causes a deceleration in the growth of consumption as well.
• In case of India, the lag between rate of fixed investment and its impact on GDP growth is seen to be of three to four years and the impact of GDP growth on consumption growth gets reflected in one to two years.
• The fixed investment rate has started declining sharply since 2011- 12 and subsequently plateaued from 2016- 17 onwards which led to the deceleration in growth since 2017-18.
Decline in fixed investment rate
• The fixed investment by households dropped from 14.3 per cent to 10.5 per cent 2009-14 to 2014-19.
• Fixed investment in the public sector marginally decreased from 7.2 per cent of GDP to 7.1 per cent during the two periods.
• However, the stagnation in private corporate investment at approximately 11.5 per cent of GDP between 2011-12 and 2017- 18 has a critical role to play in explaining the slowing cycle of growth and, in particular, the recent deceleration of GDP and consumption.
Drag of financial sector on private corporate investment
• A sudden credit expansion, which is purely supply led, results in short lived expansion of output and employment but causes significant contraction in the long run.
• In most of the cases, the credit channel works through household debt where households increase demand using debt in the short run and reduce demand later during the deleveraging phase, thereby, resulting in recessions. In the Indian context, the credit channel has worked through corporate investment.
• The bust following the enormous lending boom of the mid and late 2000s was characterized by deleveraging and low investment rate in the corporate sector, eventually causing the recent deceleration of GDP growth.
• It can be seen through correlation that firms that excessively borrowed between 2007- 08 to 2011-12 actually ended up investing significantly less during 2012-13 to 2016-2017.
Decline in household investment
• The household sector includes family households as well as ‘quasi-corporates’. It supplies investment for direct retail consumption, to incorporated enterprises from the back end of the value chain and to real estate sector.
• The sector witnessed investment stagnation in ‘Machinery and equipment’ and investment decline in ‘Dwellings, other buildings and Structures’ which together account for more than two-thirds of total household sector investment. This can be attributed to leveling of private corporate investment.
Delayed decline in private consumption
• Private consumption increased as a proportion of GDP from 2009-16, thereafter it declined in 2017-18 and rose again in 2018- 19, before declining sharply in H1 of 2019-20.
• S ince the effect of GDP growth on consumption manifests after a lag of 1-2 years, the declining trend in consumption from 2017-18 reflects partly the effect of decline in GDP growth on consumption.
Outlook
• The IMF in its January 2020 update of World Economic Outlook has projected India’s real GDP to grow at 5.8 per cent in 2020-21.
• World Bank in its January 2020 issue of Global Economic Prospects also sees India’s real GDP growing at 5.8 per cent in 2020-21.
II. FISCAL DEVELOPMENTS
Introduction
• In 2019-20, Centre’s fiscal deficit was 3.3 per cent of GDP down from 3.4 per cent of GDP in 2018-19.
• The year 2019-20 has been challenging for the Indian economy owing to the decelerating growth rate experienced in the first half of the year.
• Considering the urgent priority of the Government to revive growth in the economy, the fiscal deficit target may have to be relaxed for the current year.
• Amidst the global setting of subdued growth and intensified trade tensions, Government reaffirmed its commitment to growth with macroeconomic stability.
• The Medium Term Fiscal Policy (MTFP) Statement presented with the Budget 2019-20, pegged the fiscal deficit target for 2019-20 at 3.3 per cent of GDP and 3 per cent of GDP in 2020-21, continuing at the same level in 2021-22.
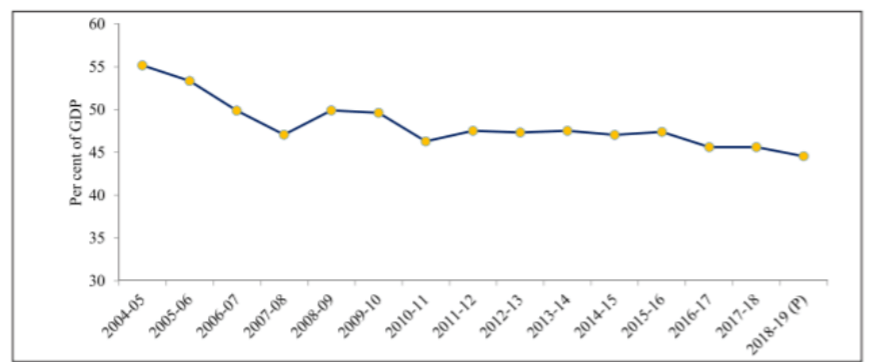
• It was further projected that Central Government liabilities will come down to 48.0 per cent of GDP in 2019-20, 46.2 per cent of GDP in 2020-21 and 44.4 per cent of GDP in2021-22.
Central Government Finances
Trends in Receipts
• The Budget 2019-20 targeted a high growth in Non-debt receipts of the Central Government, which was driven by high expected growth in Net Tax revenue and Non-Tax revenue.
Tax Revenue
• The direct taxes, comprising mainly of corporate and personal income tax, constitute around 54 per cent of GTR.
• Receipts from corporate and personal income tax have improved over the last few years.
• Better tax administration, widening of TDS carried over the years, anti-tax evasion measures and increase in effective tax payers base have contributed to direct tax buoyancy.
• Widening of tax base due to increase in the number of indirect tax filers in the GST regime has also led to improved tax buoyancy.
• Several initiatives by GSTN have been taken to create an environment of voluntary compliance based on taxpayers’ behaviour parameters through deterrence, developing social and personal norms, reducing complexity, and enhancing fairness and trust
o E-way bill
o Return filing status of a GSTIN visible in public domain on the GST Portal
o SMSs for reminders of due date of monthly return
o Free accounting & billing software provided to small taxpayers
o Compliance rating score of the taxpayers available in the public domain
o Acknowledging contribution of compliant taxpayers.
Central Government Receipts
It can broadly be divided into non-debt and debt receipts.
• The non-debt receipts comprise of tax revenue, non-tax revenue, recovery of loans, and disinvestment receipts.
• The debt receipts mostly consist of market borrowings and other liabilities, which the government is obliged to repay in the future
Major measures taken for Direct taxes during 2019-20
• Mandatory furnishing of ITR for persons entering into high value transactions.
• Interchangeability of PAN and Aadhaar.
• Incentives to International Financial Services Centre (IFSC), start-ups, resolution of distressed companies and National Pension System (NPS) subscribers.
Major measures taken for Indirect taxes during 2019-20
• Sabka Vishwas (Legacy Dispute Settlement) Scheme 2019: It is a one-time measure for liquidation of past disputes of Central Excise, Service Tax and 26 other indirect tax enactments.
• Quick Response (QR) Code has been proposed to implement the system of invoice with dynamic QR code for all B2C invoices for certain taxpayers.
• Generation and quoting of Document Identification Number for all communications sent by its offices to taxpayers and other concerned persons.
Non-Tax Revenue
• Non-Tax revenue comprises mainly of interest receipts on loans to States and Union Territories, dividends and profits from Public Sector Enterprises including surplus of Reserve Bank of India (RBI) transferred to Government of India, receipts from services provided by the Central Government and external grants.
• The Budget 2019-20 aimed to raise Non-Tax revenue to 1.5 per cent of the GDP.
• Roughly, two third of this increase in the BE is envisaged from dividends and profits especially surplus transferred by RBI.
Non-debt Capital receipts
These mainly consist of recovery of loans and advances, and disinvestment receipts.
• Over the last few years, the contribution of Non-debt Capital receipts has improved in the total pool of Non-debt receipts.
• The receipts from recovery of loans and advances have been declining over the years.
• The major component of Non-debt Capital receipts is disinvestment Receipts that accrue to the government on sale of public sector enterprises owned by the government (including sale of strategic assets). Government aimed at mobilising 1.05 lakh crore on account of disinvestment proceeds asper 2019-20 BE.
• Given the significant pipeline of deals that are in process, realizations are likely to accelerate.
Trends in Expenditure
• Central Government budgetary expenditure is envisaged to increase by one percentage point of GDP in 2019-20. The entire increase is on revenue account with capital spending remaining unchanged as per cent of GDP.
• Expenditure on defence services, salaries, pensions, interest payments and major subsidies account for more than sixty per cent of total expenditure.
• Budgetary expenditure on subsidies has seen significant moderation through improved targeting and considerable restructuring and reclassification of Central sector and Centrally Sponsored Schemes in the recent years.
• Apart from budgetary spending, Extra Budgetary Resources (EBR) have also been mobilized to finance infrastructure investment since 2016-17.
Transfer to States
• Transfer of funds to States comprises essentially of three components: share of States in Central taxes devolved to the States, Finance Commission Grants, and Centrally Sponsored Schemes (CSS), and other transfers.
• Both in absolute terms and as a percentage of GDP, total transfers to States have risen between 2014- 15 and 2018-19 RE.
• The Budget 2019-20 envisages an increase in expected grants and loan to States relative to 2018-19 RE, on account of higher requirements under compensation to States for revenue losses on roll out of GST, grants to rural and urban bodies and releases under Samagra Shiksha.
Recently Government has undertaken major changes in the corporate tax rate:
• The Government announced a major cut in the corporate income tax (CIT) rate applicable to the domestic companies by the ‘Taxation Laws (Amendment) Act, 2019, which introduced two new sections viz. 115BAA and 115BAB in the Income Tax Act.
• The existing companies have been given an option to forego certain deductions and exemptions availed under the Act and choose a new CIT rate structure with a maximum marginal rate (MMR), inclusive of surcharge and cess, of 25.17 per cent as against the existing MMR of 34.61 per cent.
• In order to give boost to the manufacturing sector, the new manufacturing companies registered on or after 1.10.2019 have been given an option to choose a CIT rate with MMR of 17.16 per cent.
• However the CIT rate applicable to the foreign companies remained unchanged.
Central Government Debt
• Total liabilities of the Central Government, as a ratio of GDP, have been consistently declining, particularly after the enactment of the FRBM Act, 2003. This is an outcome of both fiscal consolidation efforts as well as relatively high GDP growth.
• Central Government debt is characterised by low currency and interest rate risks. This is owing to low share of external debt in the debt portfolio and almost entire external borrowings being from official sources.
• The proportion of dated securities maturing in less than five years has seen consistent decline in recent years. The weighted average maturity of outstanding stock of dated securities of the Government of India has increased from 9.7 years at end March 2010 to 10.4 years at end March2019. This lends certainty and stability to budget in terms of interest payments.
III. TRADE
India’s Balance Of Payments
• The BoP position of India improved from accumulated foreign reserves of US$ 304.2 billion at end of 2013-14 to US$ 412.9 billion at end of 2018-19.
• Despite GDP growth decelerating in 2019-20 the global sentiment has remained positive.
• Yet the improvement has an undercurrent of vulnerability since the improvement in BoP has emanated from a lower growth of imports following a sharp deceleration in GDP growth and some easing of crude prices besides continued acceleration in FDI inflows. The weakening of the GDP growth poses a challenge to both net FDI and net FPI inflows.
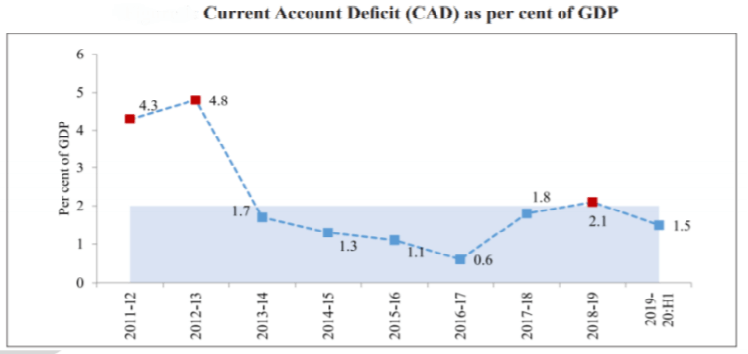
Current Account Deficit (CAD):
• An increase in CAD as a ratio to GDP worsens the BoP by drawing down on forex reserves or building the potential to worsen it by increasing the external debt burden.
• CAD to GDP ratio has been significantly improving from 2009-14 to 2014-19 and remained lower (1.5 per cent of GDP) in the first half of 2019-20 as compared to 2018-19.
• CAD/forex ratio increased from 10.6 per cent in 2013-14 to 13.9 per cent in 2018-19 and caused the rupee to depreciate.
• Nominal Exchange Rate (NER) has more or less stayed stable.
Merchandise Trade Deficit
It is the largest component of India’s current account deficit.
• On average, India’s merchandise trade balance has improved from 2009-14 to 2014- 19 on account of more than fifty per cent decline in crude prices in 2016-17.
• Since 2017-18 the adverse movement in Net terms of trade (NTT) has started which has contributed to the improvement in trade balance.
• India’s top 10 trading partners during 2019-20 (April-November) jointly account for more than 50 per cent of India’s total merchandise trade.
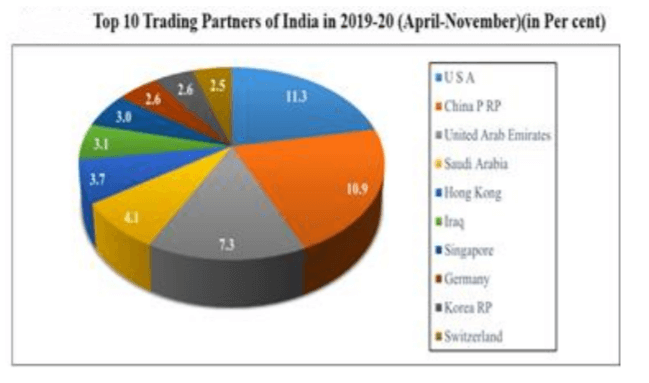
• With two top trading countries i.e. USA and United Arab Emirates, India has consistently run trade surplus since 2014-15.
• India has trade deficit continuously since 2014-15 with respect to other major trading partners i.e. China PRP, Saudi Arabia, Iraq, Germany, Korea RP, Indonesia and Switzerland.
• India had trade surplus with Hong Kong and Singapore till 2017-18, before it changed to trade deficit in 2018-19.
Merchandise Exports
An increase in merchandise exports to GDP ratio has a net positive impact on BOP position.
• Over the years, the merchandise exports to GDP ratio has been declining.
• Slowdown of world output (due to escalation of global trade tensions) and appreciation in the real exchange rate have contributed to the declining exports to GDP ratio in recent times.
• Petroleum, Oil and Lubricants (POL) exports have a dominant share in India’s export basket. Growth in Non-POL exports dropped significantly from 2009-14 to 2014-19.
• In 2019-20 (April-November), in terms of value petroleum products is the largest exported commodity while in terms of growth, it was drug formulations, biologicals.
Merchandise Imports
An increase in the merchandise imports to GDP ratio has a net negative impact on the BoP position.
• Over the years the merchandise imports to GDP ratio has been declining for India and may be a reflection of a deceleration in GDP growth.
• In the import basket of 2019-20 (April-November), crude petroleum had the largest share followed by gold and petroleum products.
• Between 2011-12 and 2019-20, imports of Electronics grew the fastest from a negligible share to 3.6 per cent.
• The share of Gold imports remained the same between 2018-19 and the first half of 2019-20, despite an increase in gold prices, possibly due to increase in import duty.
• Non-pol-non-gold imports fell as a proportion to GDP from 2009-14 to 2014-19 because of consumption driven growth and decline in the investment rate.
o Continuous decline in investment rate decelerated GDP growth, weakened consumption and dampened the investment outlook which caused these imports to fall.
Net Services
• India’s net services surplus has been steadily declining in relation to GDP since it reached its peak to about two-thirds of merchandise deficit in 2016-17.
Service Exports
An increase in service exports to GDP ratio has a net positive impact on the BoP position.
• India’s service exports have consistently hovered between 7.4 to 7.7 per cent of GDP.
• Software services constitute around 40-45 per cent, followed by business services at about 18-20 per cent, travel at 11-14 per cent and transportation at 9-11 per cent of service exports.
Service Imports
• An increase in service imports to GDP ratio has a net negative impact on the BoP position.
• Over the years, service imports in relation to GDP has been steadily rising given arising level of FDI and a gradual upscaling of the Make in India program.
• Business services constitute about a third of service imports and the component of travel services has been steadily increasing reflecting the growing attractiveness of global destinations to the domestic tourists in the country.
India and WTO
• India hosted a WTO Ministerial Meeting of Trade Ministers in May 2019 in New Delhi.
• The meeting culminated in an outcome document, which lays out priorities for developing countries in various areas and envisages addressing the challenges being faced by the Dispute Settlement system of the WTO.
• India has made submissions regarding:
o Spelling out the priorities that are required to be taken into consideration while undertaking reforms in the WTO with emphasis on special and differential treatment provisions that are essential for better integration of the developing countries in the global trading system.
o Transparency and notification requirements which outlines that Developing countries including the least developed countries, who are already resource/ capacity constrained should not be penalized in the name of improving transparency.
• Other issues raised by India at the WTO include:
o the need of a permanent solution in public stockholding for food security programmes.
o fisheries subsidies negotiations.
o the interests of poor, small and artisanal farmers as a priority in the negotiations.
Trade Facilitation
• India ratified the WTO Agreement on Trade Facilitation (TFA) in April 2016 and subsequently constituted a National Committee on Trade Facilitation (NCTF).
• National Trade Facilitation Action Plan (NTFAP 2017-20) containing specific activities to further ease out the bottlenecks to trade was also released.
• As a result of consistent trade facilitation efforts, India has improved its ranking from 143 in 2016 to 68 in 2019 under the indicator, “Trading across Borders”, in World Bank’s Ease of Doing Business Report.
• In a recently released UN global survey on digital and sustainable trade facilitation 2019, India has improved its overall trade facilitation score from 69 per cent to 80 per cent outperforming other countries in the Asia-pacific and South and Southwest Asia region.
Key initiatives for trade facilitation
• Self e-sealing through RFID tag by trusted exporters,
• Introduction of ‘E-Sanchit’ for lodging supporting documents online,
• Tracking of imported cargo clearance time through Indian Customs Ease of Doing Business Dashboard (ICEDASH),
• Launch of Atithi mobile App for international passengers.
• National level Time Release Study (TRS) across multiple locations covering seaports, Inland Container Depots (ICDs), air cargo complex etc. to achieve cargo release time targets.
Anti-dumping and Safeguard Measures
• India conducts anti-dumping investigations on the basis of applications filed by the domestic industry with prima facie evidence of dumping of goods in the country, injury to the domestic industry and causal link between dumping and injury to the domestic industry.
• The countries involved in these investigations are China PR, Hong Kong, Korea, Germany, EU, USA, Malaysia, South Africa, Thailand, Brazil, among others.
• Directorate General of Trade Remedies (DGTR) has introduced online portal named ARTIS (Application for Remedies in Trade for Indian industry and other Stakeholders) to submit online petitions for different trade remedies like anti-dumping duty, safeguard duty and countervailing duty.
• DGTR also conducted seminar and interactive sessions on Trade Remedy Mechanism for delegations from GCC and Zimbabwe and established a Help Desk & Facilitation Centre.
Net Remittances
An increase in net remittances improves the BoP position.
• Net remittances from Indians employed overseas has increased with the amount received in the first half of 2019-20 being more than 50 per cent of the total receivables in 2018-19.
• The Migration Report 2019 released by the United Nations has placed India as the leading country of origin of international migrants in 2019 with a diaspora strength of 17.5 million.
• Further, as per the October 2019 report of World Bank, India remained the top remittance recipient country in 2018 followed by China.
Foreign Direct Investment (FDI)
An increase in net FDI improves the BoP position.
• Net FDI inflows have continued to be buoyant in 2019- 20 attracting in the first half itself an amount more than 50 per cent of the previous year level, which can be attributed to continuous liberalization of FDI guidelines.
Foreign Portfolio Investment (FPI)
An increase in net FPI flows improves the BoP position.
• In relation to net FDI, dependence on net FPI to finance the CAD was less in 2014-19 at 17.1 per cent as compared to 45.6 per cent in 2009- 14.
• Portfolio flows in H1 of 2019-20 have turned positive, after a net portfolio outflow in 2018-19, which could be attributed to the dovish monetary policy stance of the US, enhanced liquidity in global markets and reinforced growth prospects for India post budget announcements and reform measures.
• A report on assessment of India’s BoP in 2018-19 published by RBI stated that the highest FPI outflow in the debt segment took place from the sovereign sector (i.e., G-Secs).
• In recent quarters until Q1 of 2019-20, a change in the composition of FPI flows towards more non debt creating equity and investment funds is visible.
IV. PRICES AND INFLATION
Introduction
• The global economy has been witnessing a steep decline in inflation over the past five decades.
• Emerging market economies have also experienced a remarkable decline in inflation over the same period.
• There can be many reasons that could have contributed to the steep decline in inflation in the emerging market economies like:
o The adoption of more resilient monetary and fiscal policy frameworks.
o Structural reforms of labour and product markets that strengthen competition.
o Adoption of monetary policy framework for inflation targeting.
• India, inflation has been witnessing moderation since 2014. However, recently inflation has shown an uptick with Headline Consumer Price Index-Combined (CPI-C) inflation increasing to 4.1 per cent in 2019-20 (April to December, 2019) as compared to 3.7 per cent in 2018-19.
Current trends in Inflation
• Headline inflation based on Consumer Price Index-Combined (CPI-C) has been sliding on a downward path since 2014.
o This has been led by a drastic fall in food inflation, which has fallen from 6.4 per cent in 2014-15 to 0.1 per cent in 2018-19.
• In 2019-20, there has been slight uptick in the headline and food inflation number.
o CPI-food inflation increased to 14.1 per cent mainly driven by the rise in vegetable prices.
• During 2019-20, WPI based inflation has been on a continuous fall declining from 3.2 per cent in April 2019 to 0.6 per cent in November 2019, but increased to 2.6 per cent in December 2019.
• Since July 2018, CPI-Urban inflation has been consistently above CPI-Rural inflation.
o This is in contrast to earlier experience where rural inflation has been mostly higher than urban inflation.
o The divergence has been mainly on account of the differential rates of food inflation between rural and urban areas witnessed during this period.
• In 2019-20, there has been sudden change in the trend.
o Urban areas have registered much higher food inflation when compared to rural areas.
o The slide in rural inflation could be because of fall in the growth of real rural wages.
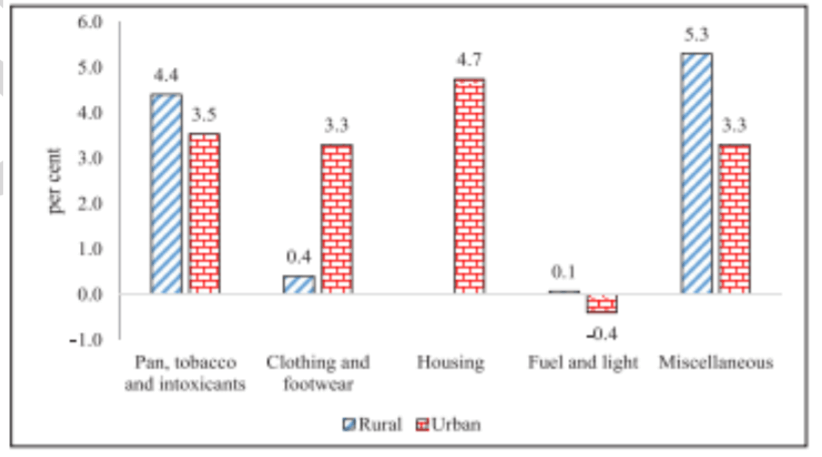
• divergence in rural-urban inflation is not just observed in the food component but in other components also
o In clothing and footwear, inflation in urban areas is higher than that observed in rural areas.
o For Paan, tobacco and intoxicants, Fuel and light and miscellaneous groups, inflation observed in rural areas was higher than that in the urban areas.
Inflation in States
• CPI-C inflation has continued to be highly variable across States.
• However, the overall inflation rate has been quite low in almost all the States.
• Though in most of the states the overall inflation rate in rural areas is lower than the overall inflation rate in urban areas.
Drivers of Inflation
• During 2019-20, food and beverages emerged as the main contributor to CPI-C inflation.
• Miscellaneous group was the second largest contributor to inflation during this period.
Crude Oil and Fuel Inflation
• World crude oil prices declined owing to weak global demand.
• As oil has a major share in the country’s import basket, it impacts considerably domestic prices of petroleum products.
• The mineral oils group in WPI saw an inflation of 5.8 per cent in mid 2019, thereafter saw continuous decline.
Food Inflation
• Some commodities such as onion, tomato and pulses have shown high inflation since August 2019.
• Untimely rains have caused lower production as well as constricted the movement of onion and tomato to the markets
• In the case of pulses, the progress in sowing has been at much lower levels than in the previous year.
• Some pulses also experienced Cobweb Phenomena which is the idea that price fluctuations can lead to fluctuations in supply which cause a cycle of rising and falling prices. The farmers are caught in the cobweb phenomenon when they base their sowing decisions on prices witnessed in the previous marketing period.
o To prevent the occurrence of the cobweb phenomenon, it is essential that apart from existing measures in place to safeguard pulses farmers from crop failure/price shocks like market intervention under Price Stabilization Fund (PSF), coverage under Pradhan Mantri Fasal Bima Yojana, PM-AASHA, providing warehouses, improving transportation, price discovery through e-NAM etc., free export of pulses also needs to be encouraged for India to become self-sufficient in pulses production.
Volatility in Essential Commodity Prices
• It has been seen that overall price volatility was highest for vegetables and lowest for rice, wheat and palm oil.
• Prices of rice and wheat remained stable since 2014 due to:
o Adequate supply arising out of sufficient domestic production
o Also due to maintenance of adequate buffer stock of rice and wheat for meeting the food security requirements.
• There was a significant rise in volatility for pulses, sugar and tomatoes during 2014 – 2019.
Causes affecting Price Volatility
• The extent to which given production and consumption shocks translate into price volatility depends on supply and demand elasticities.
• Stockholding and speculation can have major impact on price variability, either stabilising or destabilizing.
• Perishability of the commodities also adds to price volatility.
• Presence of marketing channels, storage facilities, and effective MSP system can help limit price volatility.
Measures taken by government to contain price rise of Essential Commodities
• Utilizing trade and fiscal policy instruments like import duty, Minimum Export Price, export restrictions, imposition of stock limits and advising States for effective action against hoarders & black marketers etc.
• Government also incentivizes farmers by announcing Minimum Support Prices for increasing production
• It is implementing Schemes which, inter alia, include Mission for Integrated Development of Horticulture (MIDH), National Food Security Mission (NFSM) etc. for increasing production and productivity through appropriate interventions.
• Government is also implementing Price Stabilization Fund (PSF) to help moderate the volatility in prices of agrihorticultural commodities.
• The benefit to exporters of onions under Merchandise Exports from India Scheme (MEIS) was withdrawn.
• Minimum Export Price (MEP) was imposed on onion in September 2019, and subsequently its export was banned by Government.
• It has imposed stock limits on traders across the country.
• It also facilitated private imports of onions by relaxing its fumigation norms and exempting importers from stock limits.
• Government imported onions from countries like Egypt and Turkey.
• It also directed NAFED to procure surplus Kharif onion from producing States like Rajasthan, Maharashtra and undertake distribution in deficit States.
V. EASE OF DOING BUSINESS
Introduction
• India has made substantial gains in the World Bank’s Doing Business rankings from 142 in 2014 to 63 in 2019. However, it continues to trail in parameters such as Ease of Starting Business (rank 136), Registering Property (rank 154), Paying Taxes (rank 115), and Enforcing Contracts (rank 163).

Density of Legislation and Statutory Compliance Requirements in different sectors
A major challenge most companies face is the complex architecture of the Indian governance framework including the large number of legislations and statutory compliance requirements.
• For instance:
o Manufacturing: There are 51 applicable acts and 6,796 Sections / Rules of such acts that are required to be complied with by manufacturing units in India.
o Services: This sector too faces many regulatory hurdles even for routine businesses such as opening a restaurant.
• The number of licenses required to open a restaurant in India is 12-16 in comparison to only 4 licences that are required in countries such as China and Singapore.
• Moreover, Delhi and Kolkata also require a ‘Police Eating House License’. The number of documents needed to obtain this license from Delhi Police is 45 – far more than the number of documents required for a license to procure new arms and major fireworks, 19 and 12 respectively.
• There is also a difference in approach in terms of opening a restaurant – government control versus partnership. For instance in India, only the list of licenses and permissions can be obtained from a government website whereas, in New Zealand, the privately operated website provides all detailed guides and stepwise procedures about permissions, fees and timeline to open a restaurant along with ready-to-use business plan templates.
Achieving scale across a business
• Scale is another issue that gets in the way of business efficiency in India. Most of the manufacturing units in India have small capacities and consequently low manufacturing efficiencies which are a disadvantage in the global supply chain.
• Compared to Bangladesh, China, and Vietnam, which have more than 80 per cent of market value of exports by large enterprises, India has 80 per cent by small enterprises.
Trading across borders
• The Trading Across Borders indicator records the time and cost associated with the logistical process of exporting and importing goods.
• While India takes 60-68 and 88-82 hours in border and documentary compliance for exports and imports respectively, Italy takes only one hour for each. Moreover, the cost of compliance is zero in Italy which is US$ 260-281 and US$ 360-373 for exports and imports respectively in India.
• 70 per cent of the delays (both in exports and imports) occur on account of port or border handling processes which essentially pertain to procedural complexities (number and multiplicity of procedures required for trade), multiple documentations and involvement of multiple agencies for approvals and clearances.
• While the government has already reduced procedural and documentation requirements considerably through schemes like Authorized Economic Operators, increasing digitalization and seamlessly integrating multiple agencies onto a single digital platform can further reduce these procedural inefficiencies significantly and improve user experience substantially. India’s Performance in logistics in specific segments
• Case studies of segments such as exporting apparels and carpets from India, and importing carpets to India through ports leads to the following conclusions:
o There exists inordinate delays in loading and customs processes in Indian sea-ports.
o The processes for imports, ironically, are better than those for exports.
o The large variance in process time means that exporters have to pad up the time spent waiting which adds to the clogging of port space.
• In contrast, however, the imports and exports of electronics through Bengaluru airport was found to be world class. It also provides some insight into the impact of implementation of AEO policy in changing business environment. The case study of the same suggests the following conclusions:
o the processes in Indian airports is vastly superior to those at sea ports for both imports and exports;
o AEO did significantly improve the process but it is reasonably smooth even for non-AEO operators importing/ exporting electronics
o Indian processes can beat international standards.
o The processes of Indian airports should be adapted and replicated in sea-ports.
Conclusion
• A holistic assessment and a sustained effort to ease business regulations and provide an environment for businesses to flourish would be a key structural reform that would enable India to grow at a sustained rate of 8-10 per cent per annum and leapfrogging towards a five trillion-dollar economy by 2024-25.
VI. BANKING & BANK NATIONALIZATION
Introduction
• India’s banks are disproportionately small when compared to: size of the economy (GDP), development of the economy (GDP per capita) and population.
• Credit growth among PSBs has declined significantly since 2013 even as New Private Banks (NPBs) had considerable credit growth. (Between 15% and 29%)
• Using international examples, it is estimated that in relation to the size of the Indian economy, we should have at least six banks in the global top 100.That will increase to eight, if India aspires to become a $ 5 trillion economy.
• The primary difference between PSBs and NPBs stems from the difference in efficiencies thus making a case for improving the efficiencies within PSBs.
Banking Structure: Nationalization to Today
• After the 1980 nationalization, PSBs had a 91% share in the national banking market which has reduced to 70% in recent times. Reduced stake has been absorbed by New Private Banks (NPBs) which came up in early 1990s after liberalization.
• The Government exercises significant control over all aspects of PSB operations. As a result there is an implicit promise of bailout of bank liabilities. Also, the PSB officers are subject to scrutiny by CVC and CAG making them wary of taking risks.
Benefits of Nationalization
• The allocations of banking resources to rural areas, agriculture, and priority sectors increased. For example in the period from 1969-1980-
o Number of rural Bank branches increased ten-fold.
o Credit to rural areas increased twenty-fold.
o Credit to agriculture expanded forty-fold, reaching 13% of GDP from a starting point of 2% of GDP.
• It needs to be discussed whether these benefits were entirely caused by Nationalization as the period saw various other events like green revolution, anti-poverty programmes (like Integrated Rural Development Programme) and policies of RBI (such as RBI’s 4:1 formula).
The Weakening of Public Sector Banks
• In 2019 public sector banks reported gross and net NPAs of Rs. 7.4 lakh crore and Rs. 4.4 lakh crore respectively, amounting to about 80 per cent of the NPAs of India’s banking system. (The gross NPAs of PSBs amount to 11.59 per cent of their gross advances)
• PSBs account for 92.9% of the cases of fraud, a large majority (90.2%) were related to advances, suggesting poor quality of screening and monitoring processes for corporate lending adopted by PSBs.
• Every rupee of taxpayer money invested in PSBs fetches a market value of 71 paise. Whereas, every rupee invested in NPBs fetches a market value of Rs. 3.70 i.e., more than five times as much value as that of a rupee invested in PSBs.
• PSBs perform poorly on Return-on-Assets (RoA), Return-on-Equity (RoE) and indicators like Total capital adequacy ratio when compared with NPBs.
• Suggestion – A plausible explanation for the NPA problems of PSBs is that in the Indian economy’s growth phase between 2004 and 2011, PSBs grew their loan portfolios but this credit growth was of suspect quality.
Enhancing Efficiency of PSBs: The Way Forward
• One way could be by leveraging India’s critical position in her growth trajectory with factors like positive demographic dividend, a modern digital infrastructure (driven by JAM trinity, Aadhaar and mobile network penetration) and a de novo GST structure.
• Apart from the suggestions given in various committees such as Narasimhan Committee (1991, 1997), Rajan Committee (2007) and PJ Nayak Committee (2014), the Survey has explored two solutions to decrease inefficiencieso Use of FinTech (Financial Technology) across all banking functions.
o Employee Stock Ownership across all levels.
Use of Financial Technology in PSBs
• There is availability of important ingredients with PSBs for adopting FinTech such as local market insights, long operating histories, vast geographical footprint and availability of large structured and unstructured data.
• To utilize these resources, following capabilities need to be developedo Leveraging the prevalent structured and unstructured data requires new data, analytics and modelling skills.
o The system will require complementary investments such as specialist human capital with and orientation towards analytics.
• Using Credit Analytics can have several advantages like prevention of large of proportion of NPAs, enhanced growth in retail lending (as was seen post usage of consumer credit data) etc.
• A PSB Network on lines of GSTN should be created. Following could be its possible benefitso Machine Learning (ML), Artificial Intelligence (AI) as well as Big Data and matching provide banks the ability to recognize patterns quickly by analysing vast datasets.
o It could address current issues like high operating costs, disjointed process flows from manual operations and subjective decision making.
o The AI-ML models can not only be employed when screening the corporate for a fresh loan but also for constantly monitoring the corporate borrower.
o PSBN could help PSBs take advantage of data with all the PSBs from past 50 years.
• It has proposed following structure for the same:
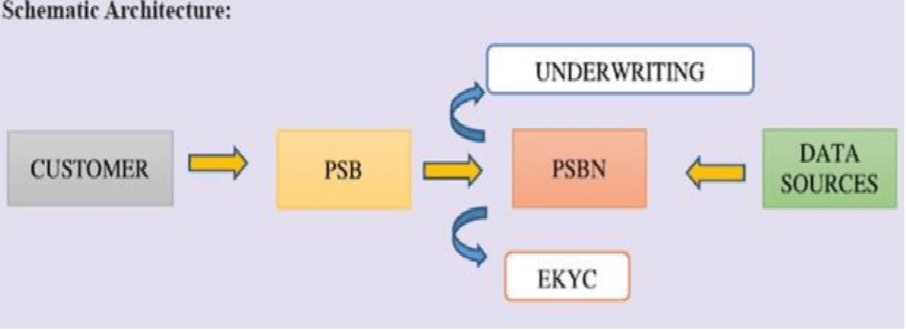
• Mechanism for PSBN: Customer approaches the PSB and indicates their loan requirement and PSB transfers this information to PSBN. PSBN completes the KYC process and generates a credit profile of the customer. Further, based on this profile the PSB takes the decision on the amount and rate of loan to be given.
Employees Stakes in PSBs
• The current salary-based compensation mechanism encourages employees to prefer safety and conservatism over risk-taking and innovation.
• As a solution to this, a portion of the government stakes can be transferred to employees exhibiting good performance across all levels of the organization through Employee Stock Option Plans (ESOPs).
• This may encourage risk-taking and possible change of mindset from that of an employee to that of an owner.
• PSBs need to enable cutting-edge recruitment practices that allow lateral entry of professionals and recruitment of professionally trained talent at the entry level.
Conclusion
• All the above recommendations need to be seriously considered and a definite, time-bound plan of action drawn up.
• With the cleaning up of the banking system and the necessary legal framework such as the IBC, the banking system must focus on scaling up efficiently to support the economy.
VII. DISINVESTMENT & PRIVATIZATION
Introduction
• Strategic disinvestment is guided by the basic economic principle that Government should discontinue its engagement in manufacturing/ producing goods and services in sectors where competitive markets have come of age.
• Such entities would most likely perform better in the private hands due to various factors e.g. technology up-gradation and efficient management practices; and would thus create wealth and add to the economic growth of the country.
Impact of Privatisation:
• The recent approval of strategic disinvestment in Bharat Petroleum Corporation Limited (BPCL) led to an increase in value of shareholders’ equity of BPCL by Rs 33,000 crore when compared to its peer Hindustan Petroleum Corporation Limited (HPCL).
• There are about 264 CPSEs under 38 different Ministries/Departments.
Since the government of India adopted strategic sale as a policy measure in 1999-2000, 11 CPSEs had undergone strategic disinvestment from 1999-2000 to 2003-04.
Examples include BALCO, Maruti, Hindustan Zinc etc.
o Comparison with peer firms: Post privatisation, these privatized CPSEs, on an average, perform better than their peers in terms of their net worth, net profit, return on assets (ROA), return on equity (RoE), gross revenue, net profit margin, sales growth and gross profit per employee.
• For example, on an average, the net worth of privatized firms increased from 700 crore before privatization to 2992 crore after privatization.
o Individual performance: Each privatized CPSE witnessed improvement in net worth, net profit, gross revenue, net profit margin, sales growth in the post privatization period compared to pre privatization period.
o Dynamic aspects of performance in comparison to peers: the performance of the privatized CPSE and its peers is quite similar during the period of 10 years before privatisation. However, post privatization, the performance of the privatized entity improves significantly over a period of 10 years when compared to the change in the peers’ performance over the same time period.
Various modes of disinvestment policy followed by the Government:
• Disinvestment through minority stake sale in listed CPSEs to achieve minimum public shareholding norms of 25 per cent. While pursuing disinvestment of CPSEs, the Government will retain majority shareholding, i.e., at least 51 per cent and management control of the Public Sector Undertakings;
• Listing of CPSEs to facilitate people’s ownership and improve the efficiency of companies through accountability to its stake holders – As many as 57 PSUs are now listed with total market capitalisation of over Rs 13 lakh crore.
• Strategic Disinvestment involves sale of substantial portion of Government shareholding in identified Central PSEs (CPSEs) up to 50 per cent or more, along with transfer of management control.
o NITI Aayog identifies PSUs for strategic disinvestment.
For this purpose, NITI Aayog has classified PSUs into “high priority” and “low priority”, based on
(a) National Security
(b) Sovereign functions at arm’s length, and
(c) Market Imperfections and Public Purpose.
• The PSUs falling under “low priority” are covered for strategic disinvestment.
• Buy-back of shares by large PSUs having huge surplus;
• Merger and acquisitions among PSUs in the same sector;
• Launch of exchange traded funds (ETFs) – an equity instrument that tracks a particular index. The CPSE ETF is made up of equity investments in India’s major public sector companies like ONGC, REC, Coal India, Container Corp, Oil India, Power Finance, GAIL, BEL, EIL, Indian Oil and NTPC; and
• Monetization of select assets of CPSEs to improve their balance sheet/reduce their debts and to meet part of their capital expenditure requirements.
Understanding different financial indicators
• Net worth: The net worth of a company is what it owes its equity shareholders. This consists of equity capital put in by shareholders, profits generated and retained as reserves by the company. An increase in net worth signals significant improvement in financial health and increased wealth creation for the shareholders.
• Net Profit: This is the net profit of the company after tax. An increase in net profit indicates greater realizations from the company after incurring all the operational expenses.
• Gross Revenue: It indicates the income of the company from sales of goods and other non- financial activities.
• Return on assets (ROA): It captures the ratio of profits after taxes (PAT) to the total average assets of the company, expressed in percentage terms. An increase in ROA indicates that privatized firms have been able to use their resources more productively.
• Return on equity (ROE): It is profit after tax (PAT) as percentage of average net worth. An increase in ROE reflects increase in firm’s efficiency at generating profits from every unit of shareholders’ equity.
• Net profit margin: Net profit margin of a company is PAT as percentage of total income. An increase in Net profit margin reflects that out of a rupee that is generated as income, the share of after-tax profit in the income increases.
Way forward
• Aggressive disinvestment, through the route of strategic sale, should be utilized to bring in higher profitability, promote efficiency, increase competitiveness and to promote professionalism in management in CPSEs. This would, in turn, unlock capital for use elsewhere, especially in public infrastructure like roads, power transmission lines, sewage systems, irrigation systems, railways and urban infrastructure.
• Many of the CPSEs are profitable but they have generally underperformed the market. The aim of any privatization or disinvestment programme should, therefore, be the maximisation of the Government’s equity stake value. For this, a structure for Corporatisation of Disinvestment is proposed.
o Under it the Government can transfer its stake in the listed CPSEs to a separate corporate entity managed by an independent board. This entity would be mandated to divest the Government stake in these CPSEs over a period of time.
o This will lend professionalism and autonomy to the disinvestment programme.