ACCOUNTING & FINANCIAL STATEMENTS
• Accounting is the systematic and comprehensive recording of financial transactions pertaining to a business.
• Accounting may be defined as identifying, measuring, recording and communicating of financial information.”
• Accounting can also be defined as the process of identifying, measuring, recording and communicating the required information relating to the economic events of an organisation to the interested users of such information.
Objectives of Accounting
Primary objectives of accounting include the following:
• Maintenance of Records of Business Transactions.
• Calculation of Profit and Loss
• Depiction of Financial Position
• Providing Accounting Information to its Users
Financial Statements
• The financial statements are the end products of accounting process. They are prepared following the consistent accounting concepts, principles, procedures and also the legal environment in which the business organisations operate.
Definition:
• Financial statements are the basic and formal annual reports through which the corporate management communicates financial information to its owners and various other external parties which include investors, tax authorities, government, employees, etc.
Objectives of Financial Statements
• To provide information about economic resources and obligations of a business.
• To provide information about the earning capacity of the business.
• To provide information about cash flows.
• To judge effectiveness of management.
• To provide information about activities of business affecting the society.
• To disclose accounting policies
Importance or Uses of Financial Statements
• Report on performance: Financial statements report the performance of the management to the shareholders. The gaps between the management performance and ownership expectations can be understood with the help of financial statements.
• Basis for fiscal policies: The financial statements provide basic input for industrial, taxation and other economic policies of the government.
• Basis for granting of credit: The financial Statements provide information to credit granting institutions like Banks etc to take decisions on provide funds to company.
• Basis for prospective investors: Financial statements help the investors to assess longterm and short-term solvency as well as the profitability of the concern.
• Guide to Shareholders: Financial Statements serve as guide to shareholders of companies, who are interested in knowing the status, safety and return on their investment.
• Aids trade associations in helping their members: Trade associations may analyse the financial statements for the purpose of providing service and protection to their members. They may develop standard ratios and design uniform system of accounts.
Types of Financial Statements:
They generally refer to:
- Balance Sheet
- Statement of profit and loss
• Apart from these, there is also a need to know about movements of funds and changes in the financial position of the company.
• For this purpose, a statement of changes in financial position of the company or a cash flow statement is prepared.
Balance Sheet
• The balance sheet shows all the assets owned by the concern, all the obligations or liabilities payable to outsiders or creditors and claims of the owners on a particular date.
Statement of Profit and Loss
• The statement of profit and loss is prepared for a specific period to determine the operational results of an undertaking. It is a statement of revenue earned and the expenses incurred for earning the revenue.
Analysis of Financial Statements
• Financial statements are mainly prepared for decision-making purposes. But the information as is provided in the financial statements is not adequately helpful in drawing a meaningful conclusion.
• Thus, an effective analysis of financial statements is required. This process of critical evaluation of the financial information contained in the financial statements in order to understand and make decisions regarding the operations of the firm is called ‘Financial Statement Analysis’.
Benefits of analysis of Financial Statements
• Measuring Profitability: Analysis of financial statement helps in ascertaining whether adequate profits are being earned on the capital invested in the business or not. It also helps in knowing the capacity to pay the interest and dividend.
• Estimate Growth Potential: The trend and other analysis of the business provide sufficient information indicating the growth potential of the business.
• Comparison: The purpose of financial statements analysis is to help the management to make a comparative study of their firm in respect of sales, expenses, profitability and utilising capital, etc. with the competition.
• Assess Financial Strength: The purpose of financial analysis is to assess the financial strength of the business.
• Anticipate Solvency: The different tools of an analysis reveal information whether the firm has sufficient funds to meet its short term and long term liabilities or not.
Tools of Analysis of Financial Statements
The most commonly used techniques for analysis of financial statements are as follows:
• Comparative Statements
• Common Size Statements
• Trend Analysis
• Ratio Analysis
• Cash Flow Analysis
Comparative Statements
• Comparative Statements are the statements showing the profitability and financial position of a firm for different periods of time in a comparative form to give an idea about the position of two or more periods.
• Comparative figures indicate the trend and direction of financial position and operating results. This analysis is also known as ‘horizontal analysis’.
• Practically, two financial statements (balance sheet and income statement) are prepared in comparative form for analysis purposes.
Common Size Statements
• These are the statements, which indicate the relationship of different items of a financial statement with a common item by expressing each item as a percentage of that common item.
• The percentage thus calculated can be easily compared with the results of corresponding percentages of the previous year or of some other firms, as the numbers are brought to common base. This analysis is also known as ‘Vertical analysis’.
• One advantage of common size statement method analysis is that it allows an analyst to compare the operating and financing characteristics of two companies of different sizes in the same industry.
• Thus, common size statements are useful, both, in intra-firm comparisons over different years and also in making inter-firm comparisons for the same year or for several years.
Trend Analysis
• The trend analysis is a technique of studying the operational results and financial position over a series of years. Using the previous years’ data of a business enterprise, trend analysis can be done to observe the percentage changes over time in the selected data.
• In this analysis the trend percentages are calculated for each item by taking the figure of that item for the base year taken as 100. Generally the first year is taken as a base year. The analyst is able to see the trend of figures, whether moving upward or downward. From this observation, a problem is detected or the sign of good or poor management is detected.
Ratio Analysis
• Described in detail below.
Cash Flow Analysis
• It refers to the analysis of actual movement of cash into and out of an organisation. The flow of cash into the business is called as cash inflow or positive cash flow and the flow of cash out of the firm is called as cash outflow or a negative cash flow.
• The difference between the inflow and outflow of cash is the net cash flow. A cash flow statement is prepared to project the movement of cash.
RATIO ANALYSIS
• Ratio Analysis describes the significant relationship, which exists between various items of a balance sheet and a statement of profit and loss of a firm.
• Ratios provide clues to the financial position of a concern.
• It enables to assess the profitability, solvency and efficiency of an enterprise.
Types of Ratios:
There is a two-way classification of ratios:
• Traditional classification
o Statement of Profit and Loss Ratios: A ratio of two variables from the statement of profit and loss is known as statement of profit and loss ratio
o Balance Sheet Ratios: In case both variables are from the balance sheet, it is classified as balance sheet ratios
o Composite Ratios: If a ratio is computed with one variable from the statement of profit and loss and another variable from the balance sheet, it is called composite ratio
• Functional classification
o Liquidity Ratios
o Solvency Ratios
o Activity (or Turnover) Ratios
o Profitability Ratios
o Leverage Ratios
I. Liquidity Ratios
• Liquidity ratios are calculated to measure the short-term solvency of the business, i.e. the firm’s ability to meet its current obligations.
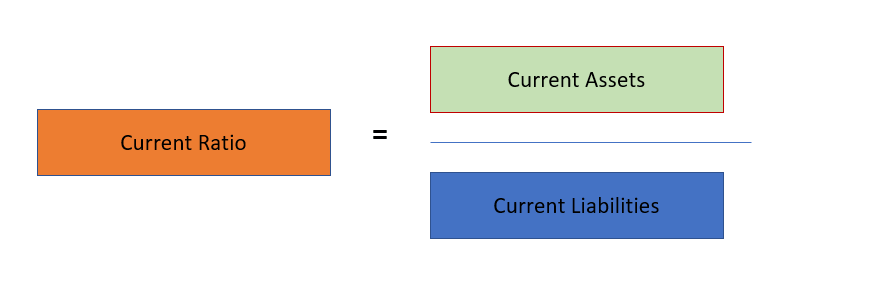
1. Current Ratio
• Current ratio is the proportion of current assets to current liabilities.
• It is expressed as follows:
Examples of Current assets
• Current investments
• Inventories
• Trade receivables (debtors and bills receivables)
• Cash and cash equivalents
• Short-term loans and advances
• Prepaid expenses
• Advance tax
• Accrued income
Examples of Current liabilities
• Short-term borrowings
• Trade payables (creditors and bills payables)
• Other current liabilities and short-term provisions
Significance of Current Ratio:
• It provides a measure of degree to which current assets cover current liabilities.
• The excess of current assets over current liabilities provides a measure of safety margin available against uncertainty in realization of current assets and flow of funds.
• The ratio should be reasonable. It should neither be very high or very low. Both the situations have their inherent disadvantages.
o A very high current ratio implies heavy investment in current assets, which is not a good sign as it reflects under-utilization or improper utilisation of resources.
o A low ratio endangers the business and puts it at risk of facing a situation where it will not be able to pay its short-term debt on time.
2. Quick Ratio
• It is the ratio of quick (or liquid) asset to current liabilities.
• It is expressed as:
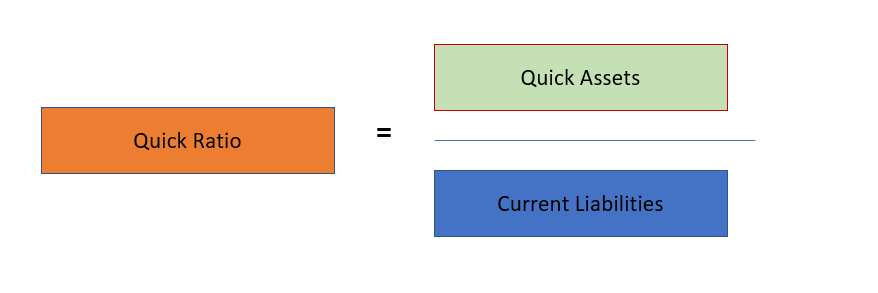
• Also called as Acid Test Ratio
Quick Assets:
• Those assets which are quickly convertible into cash.
• Examples:
• Cash and cash equivalents
• Current investments
• Trade receivables (debtors and bills receivables),
• Marketable securities
II. Solvency Ratios
• Solvency ratios are calculated to determine the ability of the business to serviceability to pay) its debt in the long run.
1. Debt-Equity Ratio
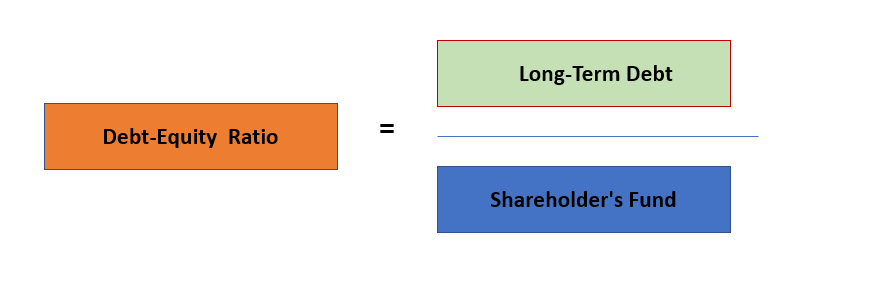
Where:
• Shareholders’ Funds (Equity) = Share capital + Reserves and Surplus + Money received against share warrants
• Share Capital = Equity share capital + Preference share capital
Or
• Shareholders’ Funds (Equity) = Non-current Assets + Working capital – Non-current liabilities
• Working Capital = Current Assets – Current Liabilities
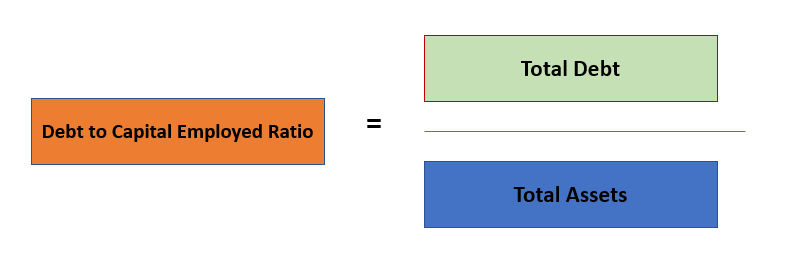
2. Debt to Capital Employed Ratio:
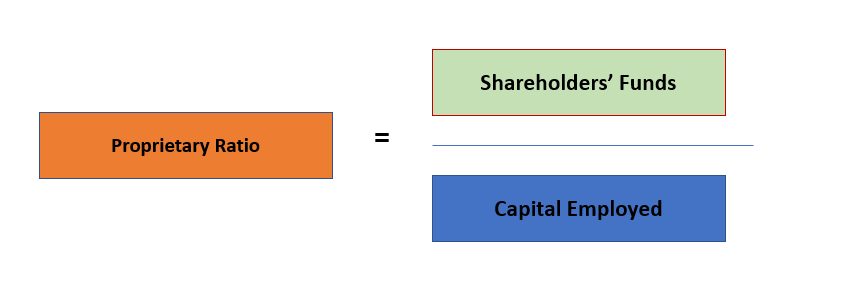
3. Proprietary Ratio
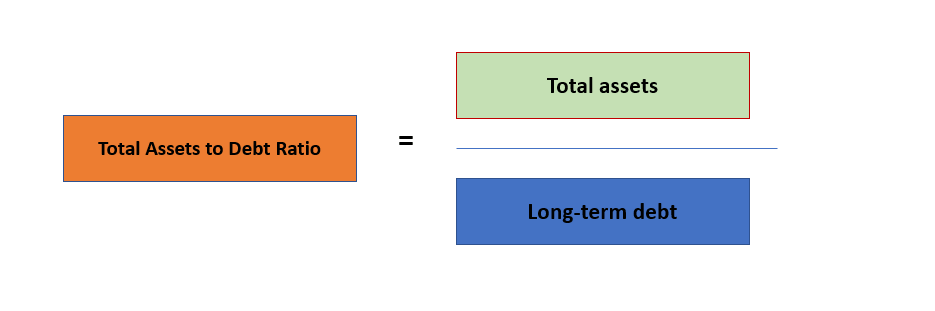
4. Total Assets to Debt Ratio
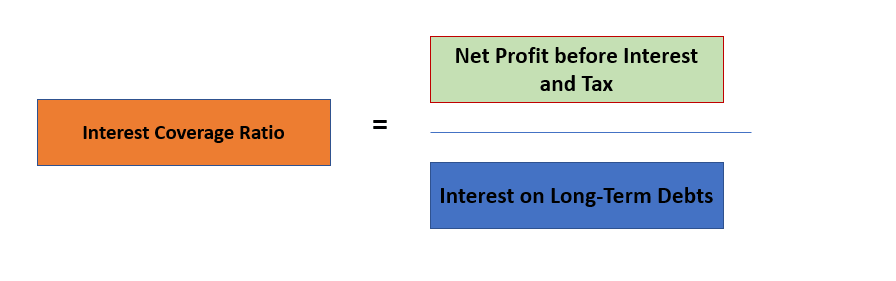
5. Interest Coverage Ratio
III. Activity (or Turnover) Ratios
• The activity ratios express the number of times assets employed is turned into sales during an accounting period.
• Higher turnover-ratios mean better utilisation of assets and signifies improved efficiency and profitability, and so are also known as efficiency ratios.
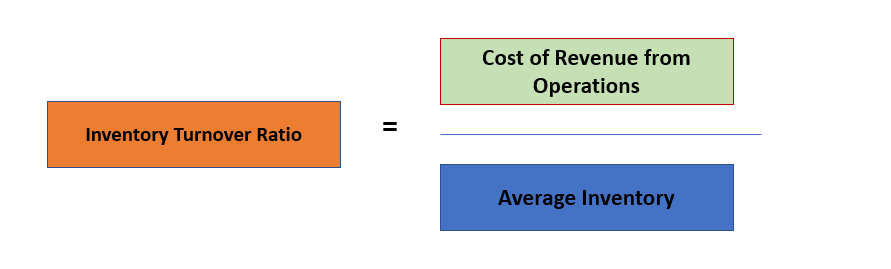
1. Inventory Turnover
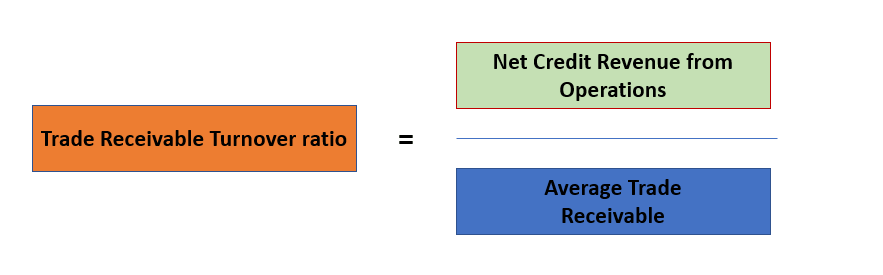
2. Trade receivable Turnover
• Where Average Trade Receivable = (Opening Debtors and Bills Receivable + Closing Debtors and Bills Receivable)/2
3. Trade payable Turnover

• Where Average Trade Payable = (Opening Creditors and Bills Payable + Closing Creditors and Bills Payable) / 2
• Average Payment Period = No. of days/month in a year / Trade Payables Turnover Ratio.
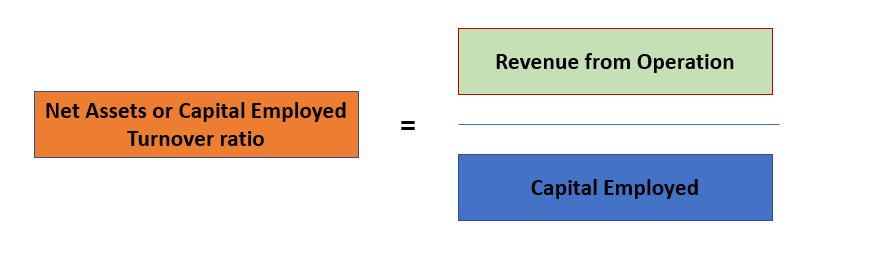
4. Investment (Net assets) Turnover
IV. Profitability Ratios
• Profitability ratios are calculated to analyse the earning capacity of the business, which is the outcome of utilization of resources employed in the business.
1. Gross Profit Ratio
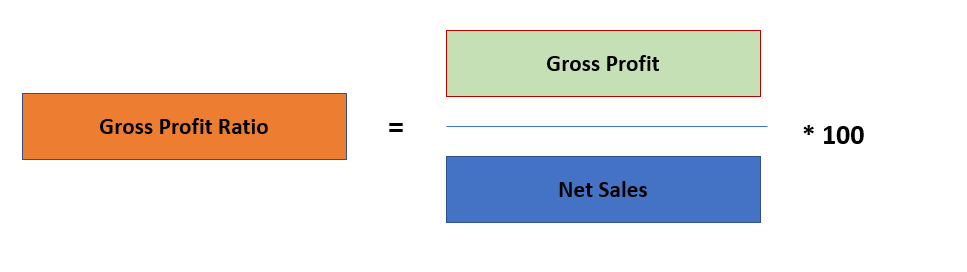
• Where Net Sales = Net Revenue from Operations Operating ratio
2. Operating profit ratio
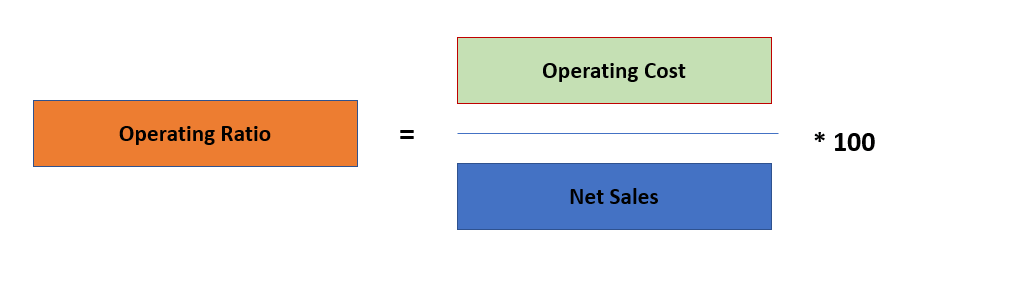
• Operating Profit Ratio = 100 – Operating Ratio
• Where Operating Profit = Net Sales – Operating Cost
3. Net Profit Ratio
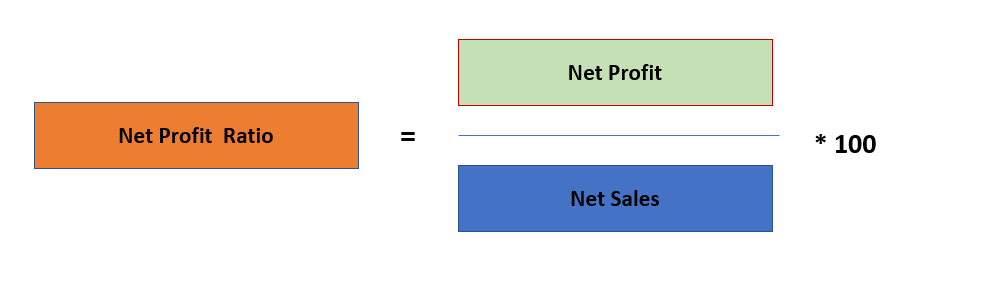
• Where Net Profit = Profit after tax (PAT)
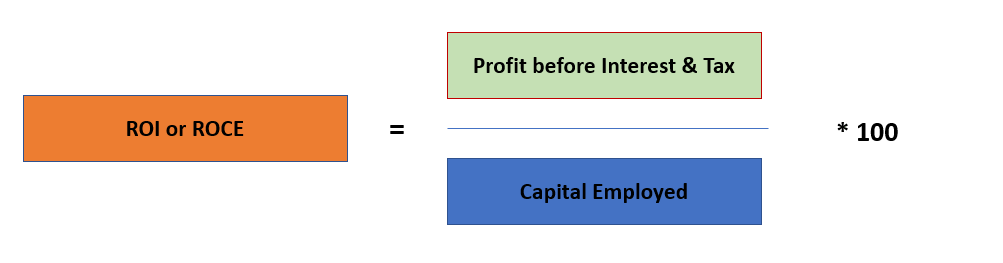
4. Return on Investment (ROI) or Return on Capital Employed (ROCE)
5. Return on Net Worth (RONW)

• Return on Shareholders’ Funds is also called as Return on Net Worth.
6. Earnings per share (EPS)

• Where Net Income = Profit after Tax
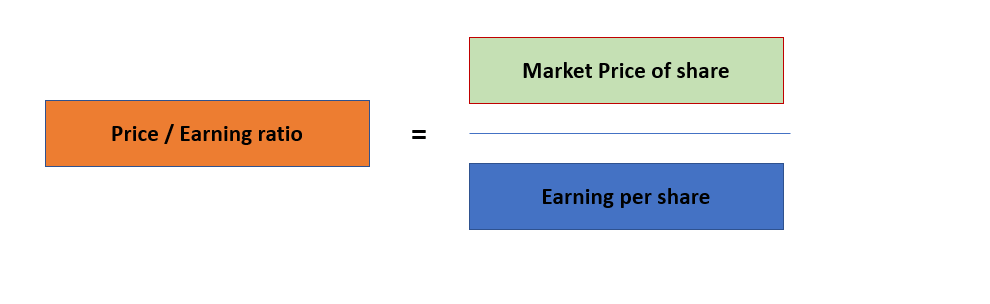
7. Price / Earning ratio (P/E Ratio)
• P/E Ratio reflects investor’s expectation about the growth in the firm’s earnings and reasonableness of the market price of its shares.
• P/E Ratio varies from industry to industry and company to company in the same industry depending upon investor’s perception of their future.
• It is computed as:
V. Leverage Ratios:
• Leverage or capital structure ratios are calculated to test the long-term financial position of a firm.
1. Capital Gearing Ratio
• The capital-gearing ratio is described as the relationship between equity share capital including reserves and surpluses to preference share capital and other fixed interest – bearing loans.
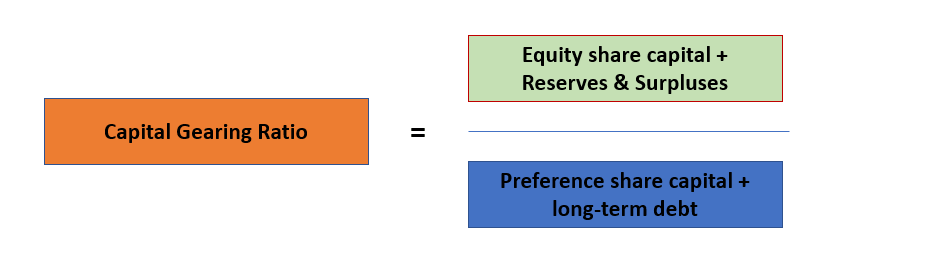
• Less than one means highly geared
• More than one means low geared
• Gearing should be kept in such a way that the company is able to maintain a steady rate of dividend.
• Borrowing is a cheap source of funds for many companies, but a highly geared company is considered a risky investment by the potential investors because such a company has to pay more interest on loans and dividend on preferred stock.
Advantages of Ratio Analysis
• Helps in Identification of problem areas.
• Simplifies complex figures and establish relationships.
• Helps to understand efficacy of decisions.
Limitations of Ratio Analysis
• They can identify the problem but do not provide any solution.
• Lack of standardised definitions.
• Lack of universally accepted standard levels
• Ignores qualitative or non-monetary aspects
• Forecasting is not feasible
• This also suffers from reliability and limitations of accounting data
• Few ratios based on unrelated figures.
WORKING CAPITAL MANAGEMENT
• Every Company makes investment in fixed and current assets. Fixed assets like plant and machinery, land and building, vehicles, etc., remains in the business for more than one year.
• On the other hand, Current assets like inventories, debtors, bills receivables, etc. get converted into cash or cash equivalents within one year.
• Some part of these current assets, are usually financed through short-term sources, i.e., current liabilities. The rest is financed through long-term sources and is called Net Working Capital.
Net Working Capital (NWC) = Current Assets (CA) – Current Liabilities (CL)
• Thus, net working capital may be defined as the excess of current assets over current liabilities.
• Working Capital Management is a process of managing short-term assets and liabilities. It makes sure that a firm has sufficient liquidity to run its operations smoothly.
Components of Working Capital:
It includes both current assets & current liabilities:
Current Assets
• Current Assets are short-term assets either in form of cash or a cash equivalent which can be converted to cash within 12 months.
• Typical current assets include:
- Cash and Cash equivalents
- Short-term investments (marketable securities)
- Accounts receivable
- Stock inventory
- Supplies
Current Liabilities
• Current Liabilities include payment obligations, which are due for payment within 1 year.
• Current Liabilities include:
- Creditors
- Bills Payable
- Bank Overdraft
- Unpaid Expenses
- Dividend Payable
- Income Tax Payable
- Short-term Credit
Working Capital Cycle
• Most of the amount invested in current assets is continuously recovered through realisations of debtors and cash sale of goods, and is reinvested in current assets.
• It keeps on revolving from cash to current assets and back again to cash. For this reason, it is also known as circulating capital.
Factors Influencing Working Capital:
Internal Factors:
- Nature of Business
- Scale of Operations/ Size of Business
- Production Cycle
- Credit Policy
- Availability of Credit
- Operating Efficiency
- Availability of raw materials
- Growth Prospects
External Factors:
- Business Cycle
- Changes in Technology
- Seasonal factors
- Inflation
- Taxation Policy
- Level of Competition
Kinds of Working Capital:

Gross Working Capital
• Gross WC is the sum of all of a company’s current assets (assets that are convertible to cash within a year or less).
• It includes assets such as cash, accounts receivable, inventory, short-term investments and marketable securities.
Net Working Capital
• Gross working capital or current assets, less current liabilities equate to Net Working Capital.
Permanent Working Capital
• A part of WC is of a permanent nature because depending on the volume of business certain amount of cash, debtors and stock-in-trade shall always be maintained by every firm.
• This part is known as permanent or fixed Working Capital.
• It must always be financed through long-term sources.
Variable Working Capital
• The remaining part of the WC requirement varies from period to period on account of fluctuations in the volume of business and is called fluctuating or variable WC.
• This part is usually financed through short-term sources like bank overdraft, trade creditors, bills payable, etc.
Importance of Working Capital
Working capital is a prevalent metric for the efficiency, liquidity and overall health of a company.
• Sufficient WC enables a business concern to make prompt payments and hence helps in creating and maintaining goodwill.
• Adequate WC management helps a firm to survive through a crisis or ramp up production in case of an unexpectedly large order.
• It helps to operate the business smoothly by making payment of short-term liabilities. This allows purchase of raw materials and payment of salary, wages and overhead can be made without any delay, which in turn, improves solvency of the business by providing uninterrupted flow of production.
• Quick payment of credit purchase of raw materials ensures the regular supply of raw materials from suppliers and improves the credit rating of the firm.